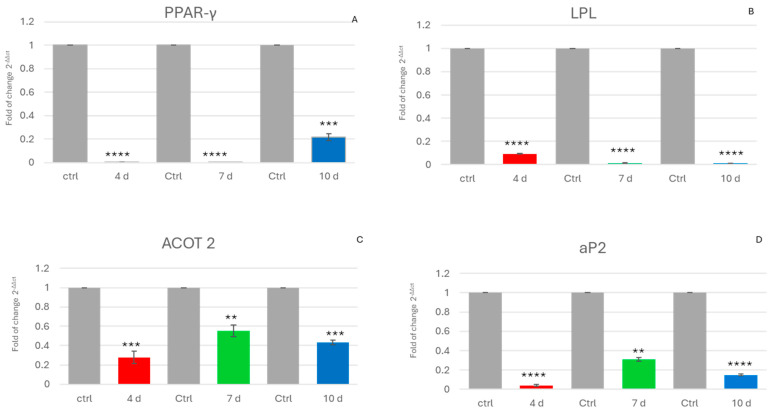
Figure 1.
Expression of adipogenic genes: The expression of PPAR-γ (A), LPL (B), ACOT 2 (C), and aP2 (D) was evaluated in hADSCs cultured in the presence of 4d-MCF-7-E.M (4 d: red bars), 7d-MCF-7-E.M (7 d: green bars), or 10d-MCF-7-E.M (10 d: blue bars). The mRNA levels for each gene were normalised to glyceraldehyde-3-phosphate-dehydrogenase (GAPDH) and expressed as the fold change (2−ΔΔCt) of the mRNA levels observed in untreated control hADSCs (Ctrl: grey bars), defined as 1 (mean ± SD; n = 6). Data are expressed as the mean ± SD relative to the control (** p ≤ 0.01), (*** p ≤ 0.001), (**** p ≤ 0.0001).

