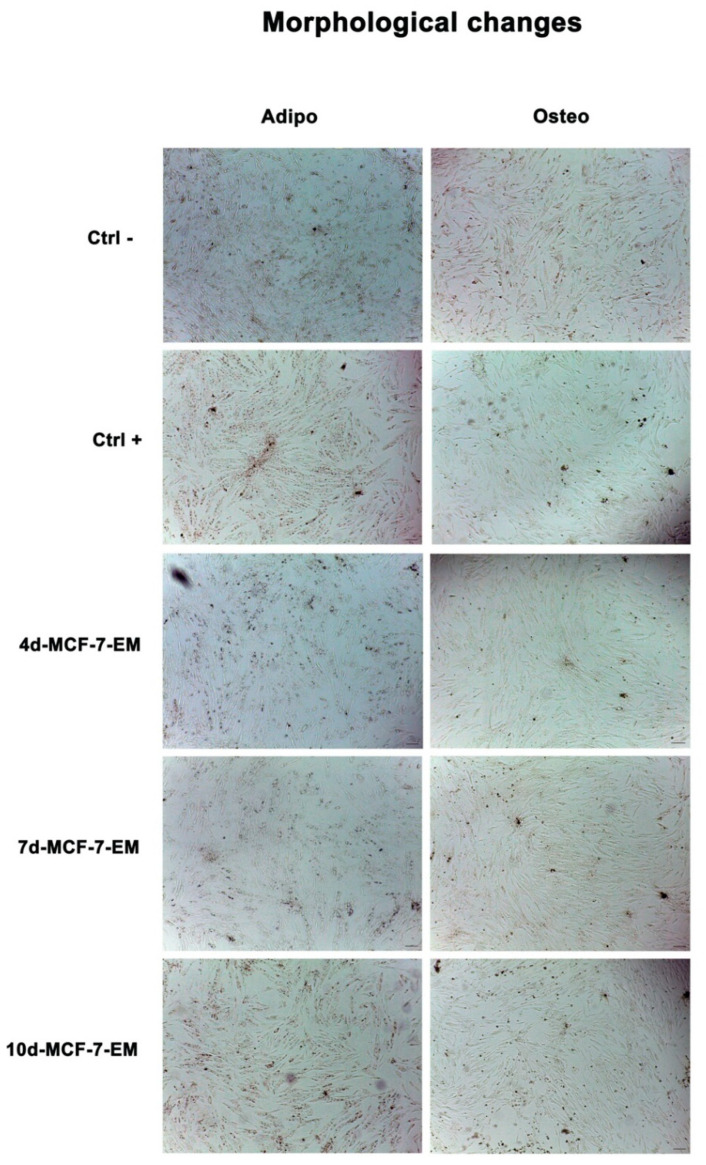
Figure 3.
Optical microscope analysis of ADSC morphology after exposure to MCF-7-E.M figure shows morphological changes in cells exposed to 4d-, 7d-, or 10d-MCF-7-E.M after 7 days in culture, as compared to untreated control cells (Ctrl). Ctrl+ represents cells exposed to the differentiation medium alone. Scale bar = 100 µm.

