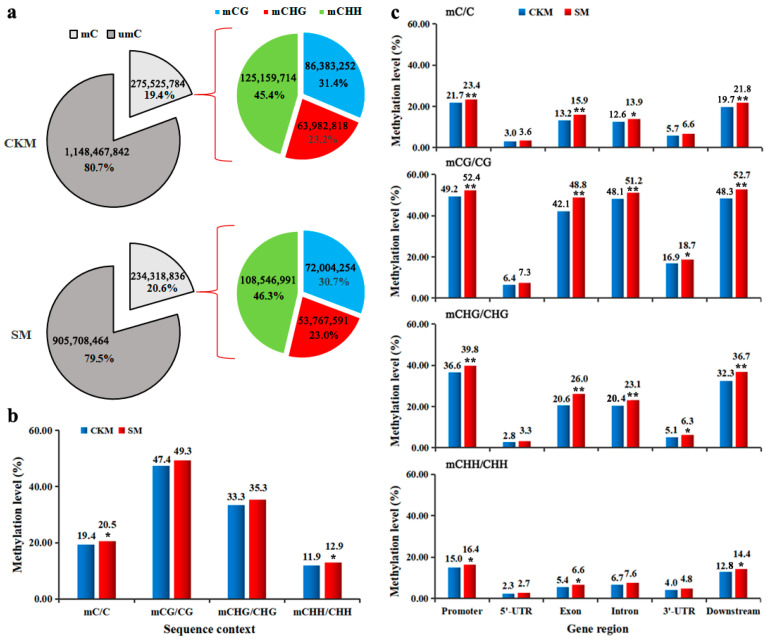
Figure 2.
Comparative analysis of DNA methylation patterns between the normal flower bud (CKM) and the wizened flower bud (SM). (a) Relative proportions of methylated cytosines (mCs) in each sequence context. (b) Statistics of methylation levels (MLs) in each sequence context across the whole pear genome. (c) Average MLs in different gene regions. The SPSS26 was used for statistical analysis. Student’s t-test was used for comparing two samples, asterisks indicate statistically significant differences between normal (CKM) and wizened (SM) flower buds (* shows p < 0.05 and ** means p < 0.01).

