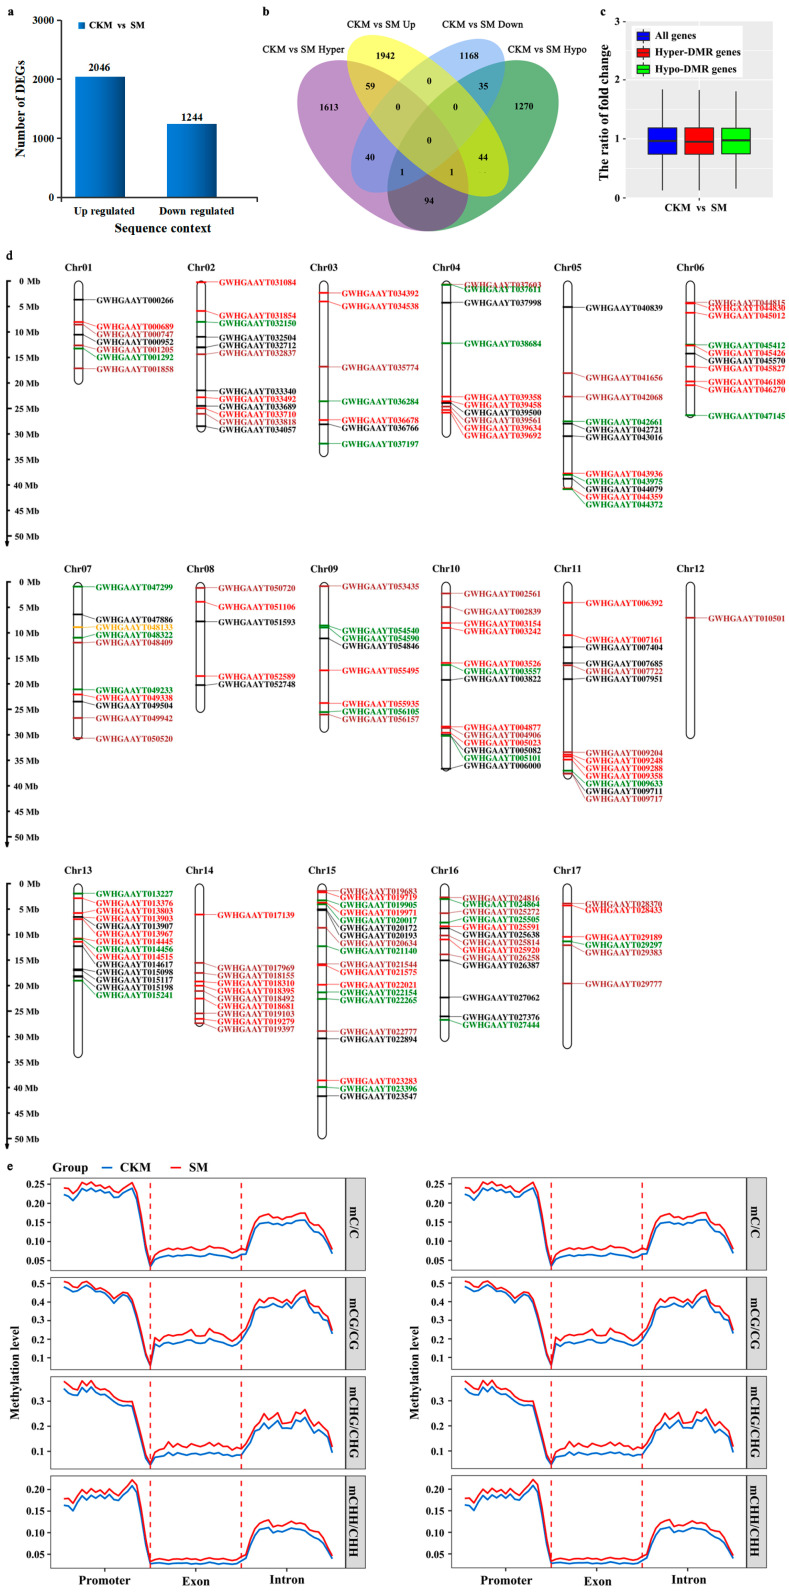
Figure 4.
Correlations between altered DNA methylation patterns and differential gene expression. (a) Numbers of differentially expressed genes (DEGs) in normal (CKM) relative to wizened (SM) flower buds. (b) Venn diagram showing overlaps between the differentially methylated genes (DMGs) and DEGs for the CHH sequence context. (c) Boxplot showing the differential expression levels of all genes and hyper− and hypomethylated genes. (d) Location distribution of DEGs associated with differentially methylated regions (DMEGs) for the CHH sequence context on different chromosomes of pear. The red and black colors represent upregulated DEGs associated with only hyper− and hypomethylated DMRs, respectively. The purple and green colors represent downregulated DEGs associated with only hyper− and hypomethylated DMRs, respectively. The orange color represents downregulated DEGs associated with both hyper-and hypomethylated DMRs. (e) Comparative analysis of MLs of C−sites in different gene regions of the up− or downregulated DEGs, including promoter, exon, and intron regions.

