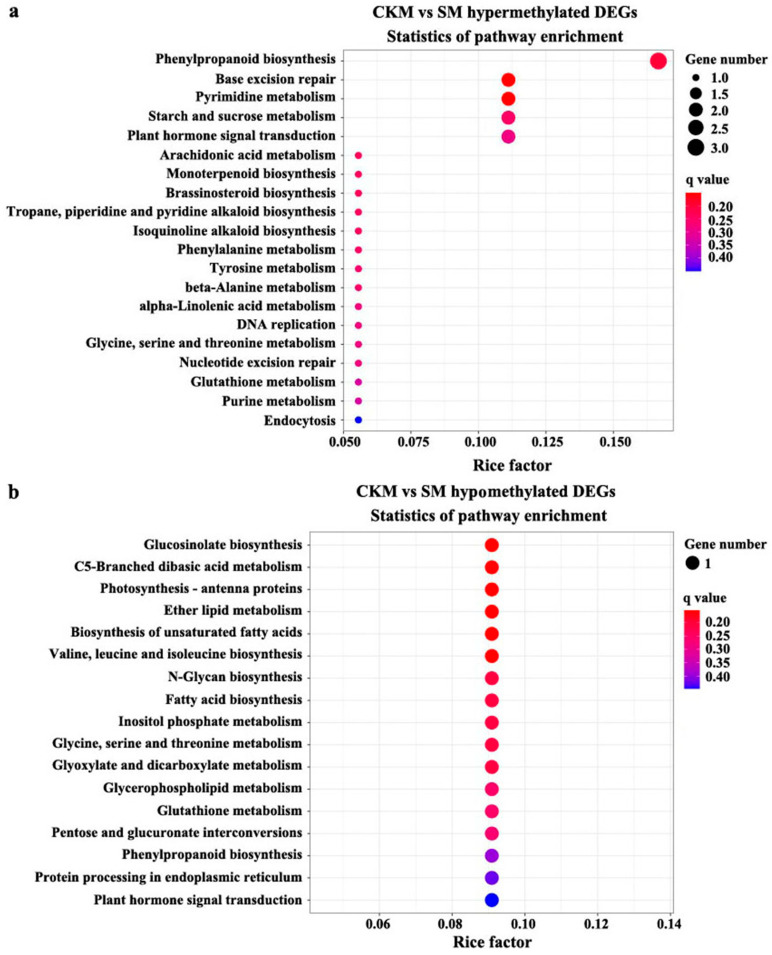
Figure 5.
Kyoto Encyclopedia of Genes and Genomes (KEGG) pathway enrichment analysis of hyper-(a) or hypomethylated (b) DEGs for the CHH sequence context in normal (CKM) versus wizened (SM) flower buds. The gene ratio is equal to the proportion of the number of differentially methylated genes (DMGs) annotated in the pathway to the total number of DMGs. The size of the circle represents the number of genes, and the color of the circle represents the q-value (corrected p-value).

