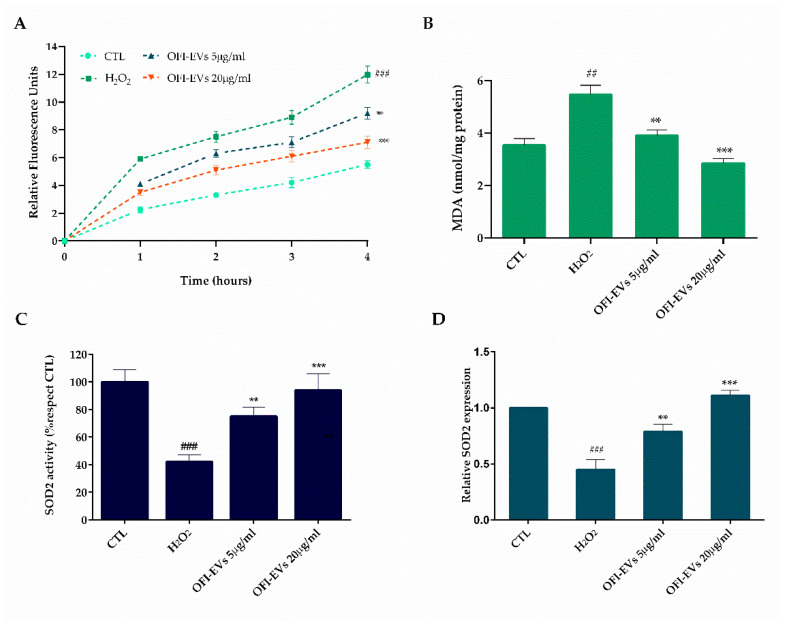
Figure 4.
Antioxidant capacity of OFI-EVs in H2O2-treated HDF cells, in the presence of OFI-EVs for 24 h and then treated with H2O2 for 24 h. (A) Oxidized H2DCFDA (DCF) was used to determine ROS release. (B) MDA quantity was utilized as a marker of lipid peroxidation. (C) Superoxide dismutase (SOD2) activity. (D) SOD2 mRNA transcription level. Results are expressed as the means of three independent experiments ± S.D (n = 3). ** p < 0.01, *** p < 0.005 vs. H2O2; ## p < 0.01, ### p < 0.005 vs. CTL.

