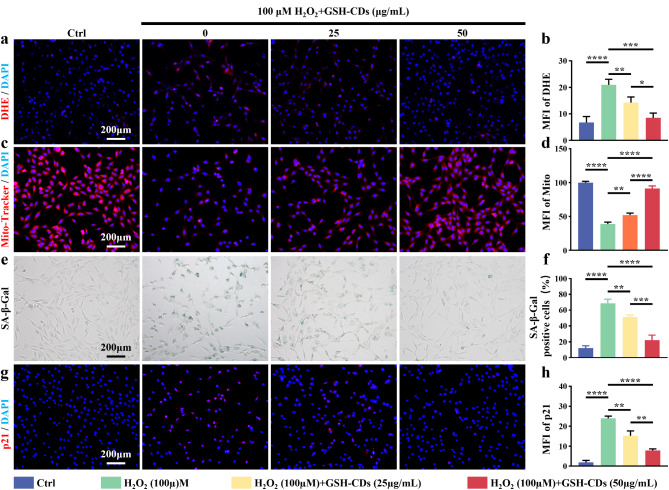
Fig. 4.
Rescue effect of GSH-CDs on NPCs senescence and mitochondrial dysfunction via the removal of excessive ROS. (a) DHE fluorescence staining images of NPCs in different groups (Scale bar = 200 μm). (b) Semiquantitative analysis of DHE staining. (c) Images of mitochondrial fluorescence staining (Scale bar = 200 μm). (d) Semiquantitative analysis of mitochondrial fluorescence intensity. SA-β-gal staining (e) of NPCs and semiquantitative analysis (f) of the percentage of SA-β-Gal-positive cells in different groups (Scale bar = 200 μm). (g) Immunofluorescence staining results of p21 in different groups (Scale bar = 200 μm). (h) Semiquantitative analysis of the fluorescence intensity of p21. (* indicates a p value < 0.05, ** indicates a p value < 0.01, *** indicates a p value < 0.001, **** indicates a p value < 0.0001)

