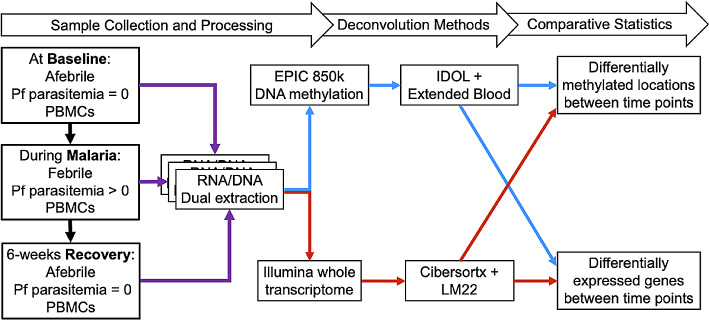
Fig. 1.
Steps for data collection and analyses. Purple lines go from the raw samples to the co-extraction step. Blue lines represent DNA-methylation-derived deconvolution methods and red lines represent transcriptome-derived deconvolution methods. For RNA, steps included Illumina whole transcriptome followed by deconvolution with the Cibersortx and the LM22 reference. For DNA, the EPIC chip was used to measure the DNA methylation across 850 K probe sites and then used for deconvolution with the IDOL and the extended blood reference [11]. The results from each deconvolution were used as covariates to model the differential gene expression and differential methylation represented by the crossing red and blue lines going from deconvolution method to differential gene expression and DNA methylation

