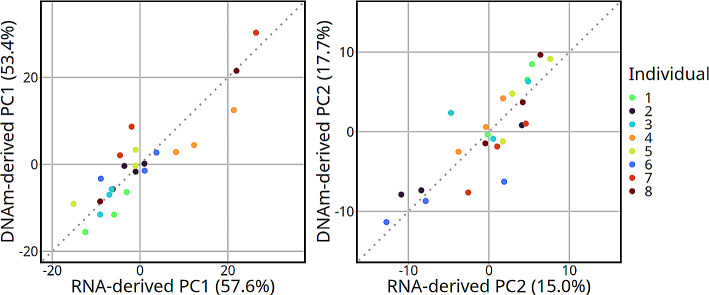
Fig. 3.
Correlation between the first and second principal components from RNA-derived and DNAm-derived deconvolution methods. Dotted lines represent the identity line. The percent of total variation captured by each respective principal component is in parentheses. The Pearson correlation coefficients left to right were 0.90 and 0.85 (both correlations have a p-value < 0.001). The x-axes represent the values for the first (PC1) and second (PC2) that were calculated with the transcriptome-derived deconvolution. The y-axes represent the values for the first (PC1) and second (PC2) from the DNAm-derived deconvolution

