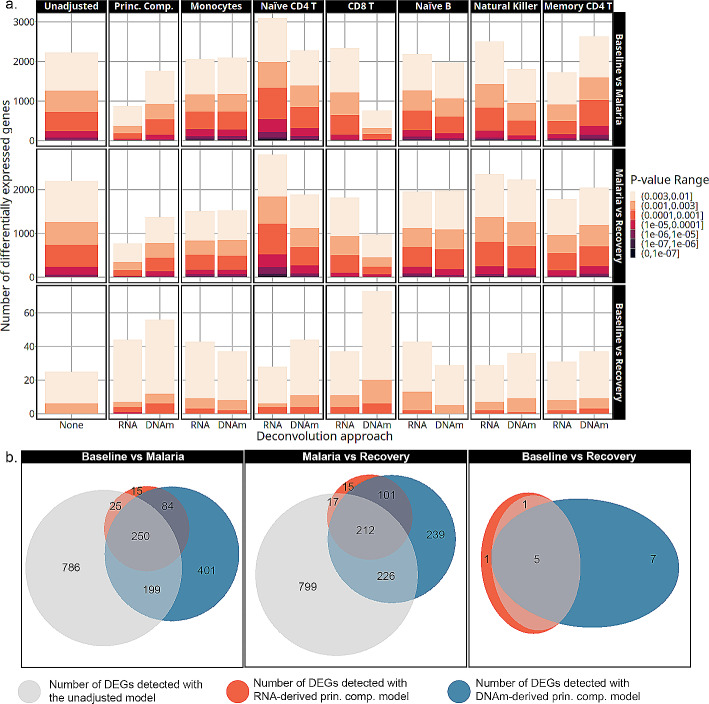
Fig. 4.
a. The number of differentially expressed genes detected by each model is on the y-axis at multiple p-value thresholds. The models are indicated by cell-type adjustment labeled across the top, contrast labeled along the right side, and deconvolution approach labeled along the x-axis. Transcriptome-derived and DNAm-derived cell-type adjustments are marked by RNA and DNAm, respectively. As colors become darker, the significance threshold becomes lower. b. Venn diagrams showing the overlap in DEGs detected with p-value < 0.003 from the unadjusted, transcriptome-derived principal components, and the DNAm-derived principal components models

