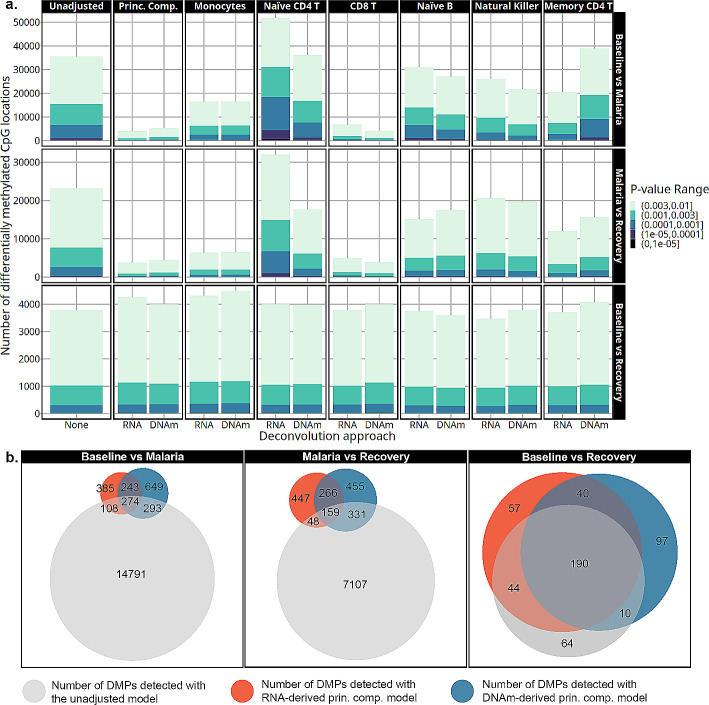
Fig. 6.
(a) The number of differentially methylated positions is on the y-axis at several p-value thresholds as detected by cell-type adjustment (labeled across the top), contrast (labeled along the right side), and deconvolution approach (along the x-axis). Transcriptome-derived and DNA-methylation-derived cell-type adjustments are marked by RNA and DNAm, respectively. As colors become darker, the significance threshold becomes higher and are listed in the legend. “Prin. Comp.” refers to the principal component-adjusted models. (b) Venn diagrams depict the overlap in DMPs selected with p-value < 0.001 in unadjusted, transcriptome-derived principal components, and the DNAm-derived principal components models

