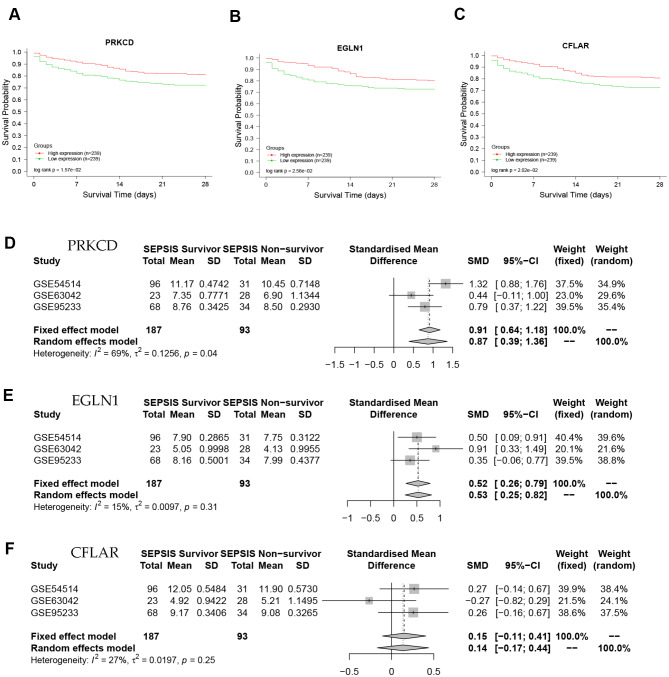
Fig. 5.
Survival curve and meta-analysis. (A-C), Based on the public dataset GSE65682, a total of 478 patients with sepsis were included in the analysis. In the survival curve, the abscissa represents the survival days, and the ordinate represents the survival rate. The red curve indicates the high expression group of the related genes, and the green curve indicates the correlation based on the low expression group. Statistical tests were performed using the logrank test. Survival curve showed the 28-day survival rate of septic patients, and it can be seen from the figure that the survival rates of patients with high expression of PRKCD, EGLN1 and CFLAR are higher than those in patients with low expression (P < 0.05). It means that high expression of PRKCD, EGLN1 and CFLAR is a protective factor for sepsis patients. (D-F), Based on the datasets GSE54514, GSE63042 and GSE95233, we performed a meta-analysis of the above three core genes in the normal and sepsis group. The data was tested for heterogeneity (I2), using a random effects model at I2>50%, and a fixed effects model at I2 ≤ 50%. For PRKCD, I2=69%, using a random-effects model, standardized mean difference (SMD) = 0.87, 95% confidence interval (CI): 0.39–1.36. For EGLN1, I2=15%, using a fixed effects model, SMD = 0.52, CI: 0.26–0.79. For CFLAR, I2 = 27%, using a fixed effects model, SMD = 0.15, CI: -0.11-0.41. It showed that PRKCD, EGLN1 and CFLAR were high expression in the sepsis survival group and low expression in non-survivor group

