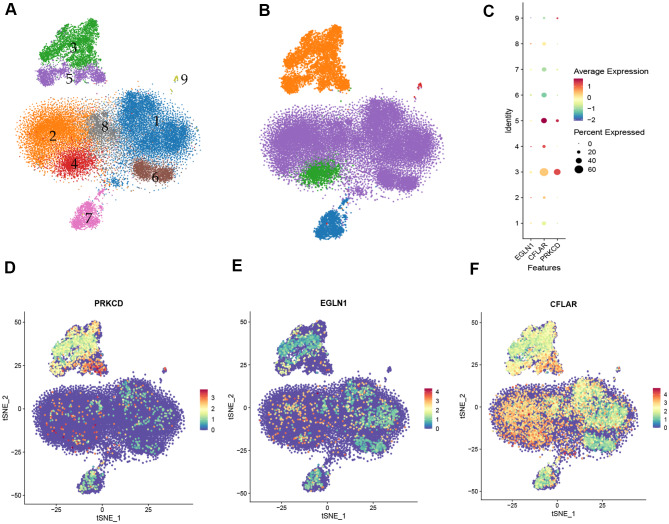
Fig. 6.
Single-cell RNA sequencing. (A), Mixed sample sequencing plot. The different colors represent cell lines containing different potential marker genes that are upregulated relative to the other cell lines. Where 1, 2, 6 and 8 represent T cells, 3 and 5 represent Macrophages, 4 represent NK cells, 7 represent B cells, and 9 represent Platelets. (B), Further visualization of the sequencing results of mixed samples. Different colors represent different cells. Orange represents Macrophages, purple represents T cells, green represents NK cells, blue represents B cells and red represents Platelets. (C). Each number in the ordinate represents a different cell line, with consistency with Fig. 6A. Different colors represent the average expression of the different cells. The diameter of the circle represents the percentage of the cells expressed. (D-F), Cell localization map showed that PRKCD were mainly localized in Macrophage cell lines, EGLN1 and CFLAR were widely localized in immune cells lines

