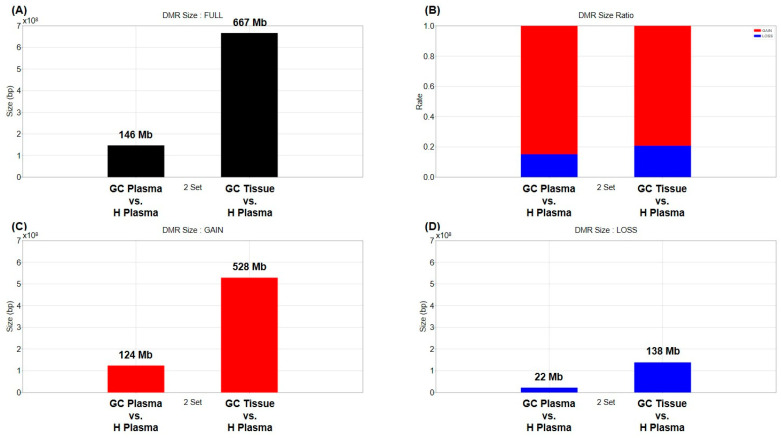
Figure 1.
Size and composition of DMR obtained by comparing tissue and plasma of gastric cancer patients with healthy donor plasma. (A) The graph shows the total number and size of DMRs obtained by comparing the gastric cancer patients’ plasma or tissue to healthy donor plasma. (B) Red and blue bars represent the proportion of methylation gain and loss among total DMRs, respectively, when compared to heathy donor plasma. (C,D) The graph shows the total size of methylation gained and methylation lost.

