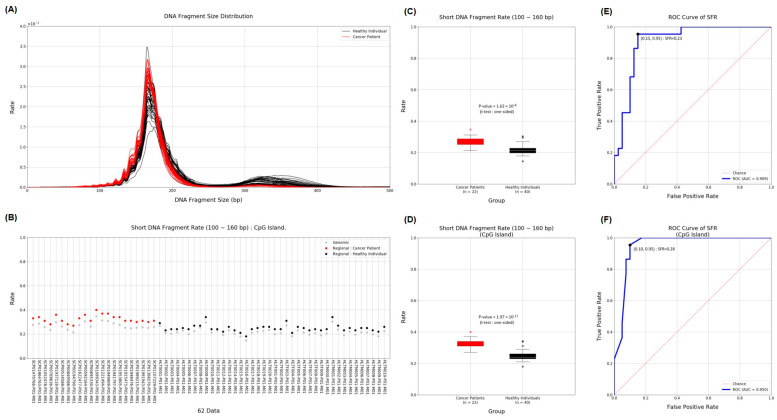
Figure 3.
Distribution of SFR and ability to distinguish between gastric cancer and normal samples. (A) The graph shows the length and distribution of cfDNA obtained from the plasma of cancer patients (red) and healthy people (black). (B) SFRs were displayed for each individual and divided into genomic regions (grey) and CpG islands (red and black). (C,D) The graph shows the SFR between the two groups of cancer patients and healthy people in genomic and CpG island regions, respectively. (E,F) The graph shows the ROC curve and AUC score of SFR in genomic and CpG island regions, respectively. ROC, receiver operating characteristic; AUC, area under the ROC curve.

