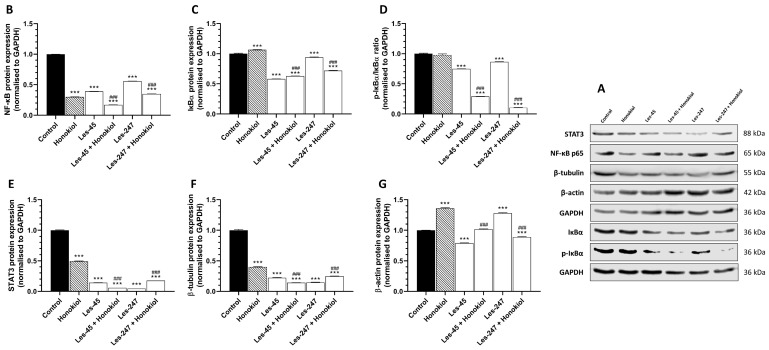
Figure 7.
Western blot analysis of inflammation-related and cytoskeletal proteins. Proteins bands, as obtained by western blotting (A). Representative Western blots of NF-κB (B), STAT3 (C), IκB-α (D), pIκB-α (E), β-tubulin (F), and β-actin (G) levels in BJ cells treated with honokiol (15 µM), Les-45 (10 µM), cells co-treated with Les-45 (10 µM) and honokiol (15 µM), Les-247 (10 µM), and cells co-treated with Les-247 (10 μM) and honokiol (15 μM). Protein bands were quantified by densitometry. The results are shown as the percentage of protein relative to the control. Each column represents the mean ± SEM of three independent experiments. The blots were stripped and reprobed with anti-GAPDH antibody to control the amounts of protein loaded onto the gel. The statistical significance of each data point was analyzed by Turkey’s test, using one-way ANOVA for each group. *** p < 0.001, compared to the control group. ### p < 0.001, compared to the honokiol-treated group.

