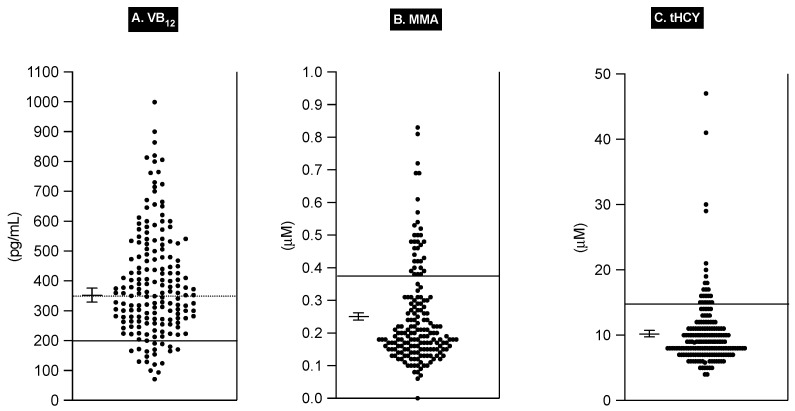
Figure 1.
Scatter diagram of serum vitamin B12 (VB12), serum methyl malonic acid (MMA), and plasma total homocysteine (tHCY) values of 175 ZES patients. Each solid dot represents the value for one of the three parameters for a given patient. The mean ± SEM for all patients is shown for each serum parameter. For VB12, the solid line at <200 pg/mL represents a commonly used value proposed for identifying patients with VB12 deficiency [112,113,114,115,118,120,233,235]. The VB12 dotted line represents the upper limit of the 200–350 pg/mL VB12 range, referring to patients with low normal levels of VB12, a proportion of whom can be VB12-deficient, which can be identified by accompanying blood MMA and/or tHCY levels [115,116,118,232]. In the serum MMA and tHCY panels, the solid line represents the upper limit of the normal level for the assays of 0.37 uM and 0.15 uM for MMA and tHCY, respectively.

