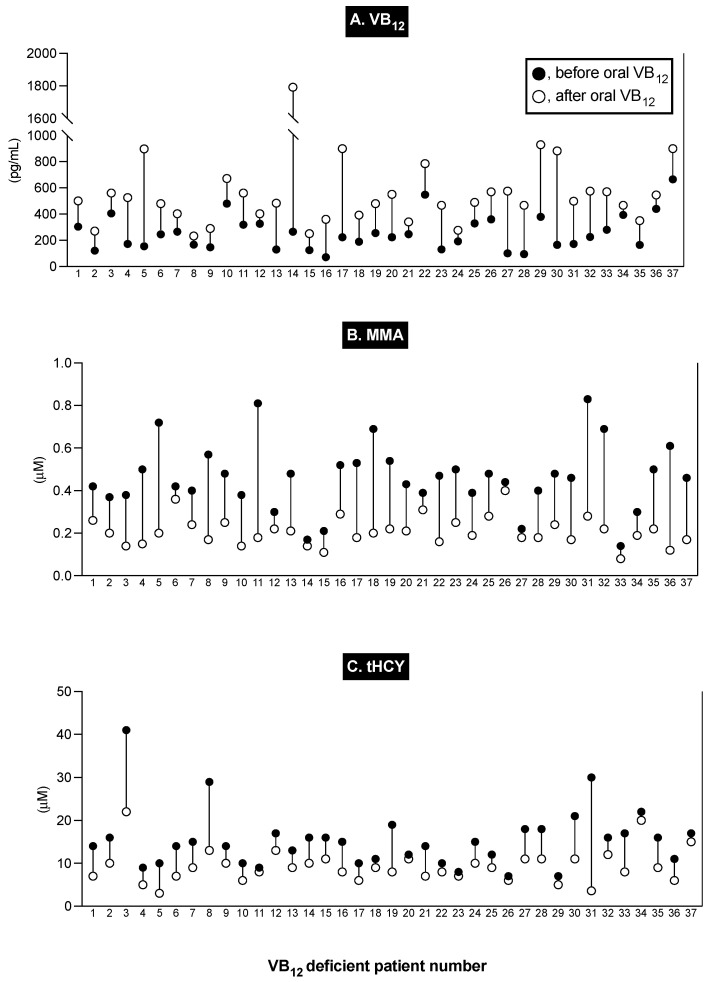
Figure 2.
Serum VB12, serum MMA, and plasma tHCY results from 37 VB12-deficient patients after taking crystalline VB12. Patient numbers are shown on the X axis, and the change in serum VB12, MMA, and tHYC are shown on the Y axis. The solid and the open circles represent the serum values before and after taking VB12, respectively.

