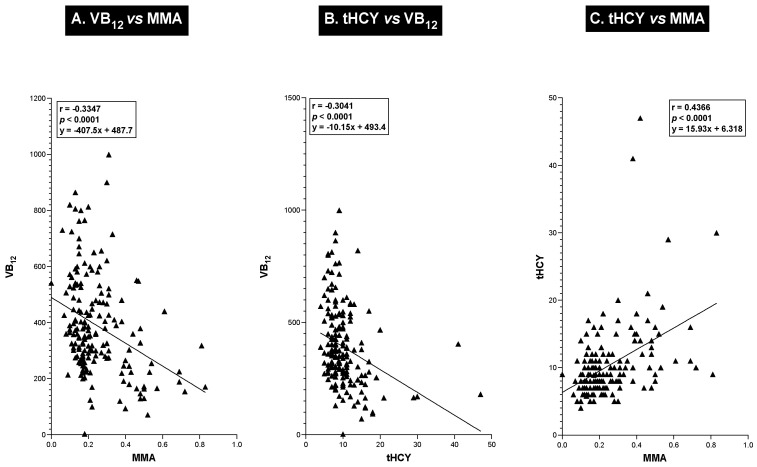
Figure 3.
Correlations between patient values for serum MMA and plasma tHYC with serum vitamin B12 levels. Each solid circle or triangle is a value from one patient determined from the same NIH admission. The correlation coefficient, its significance, and the best-fitted regression line equation (using least squares regression analysis) for each correlation are shown.

