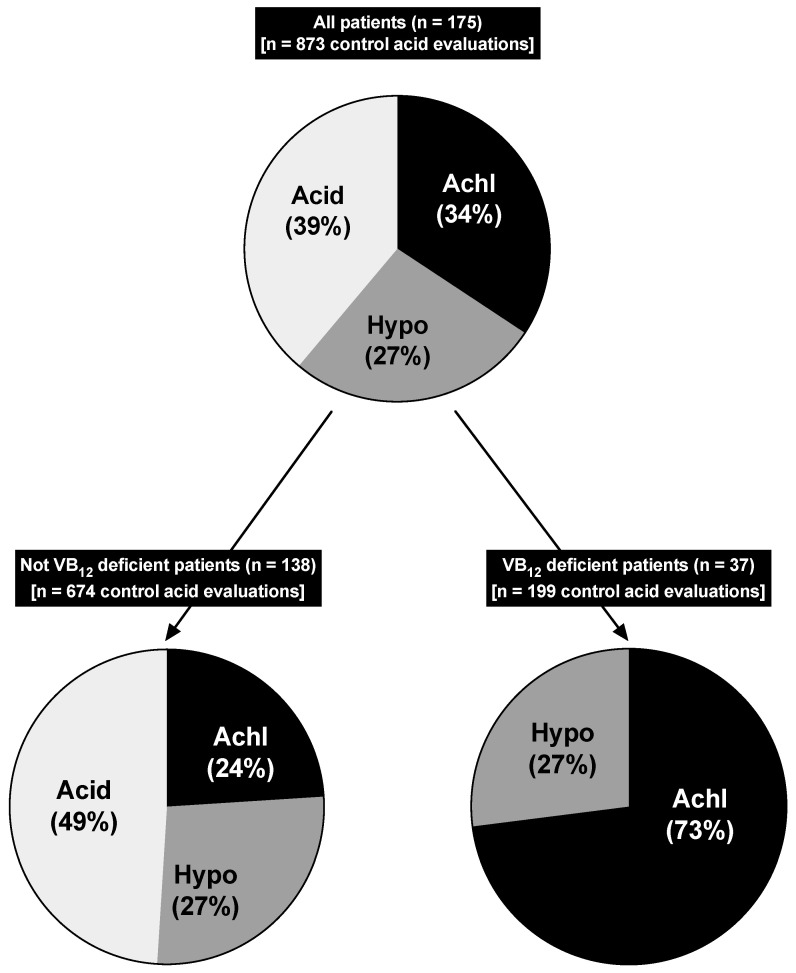
Figure 4.
Pie diagram showing mean gastric acid control value acid output category from all patient admissions [n = 873] over a 5-year period (1997–2001) stratified by presence or absence of VB12 deficiency. As outlined in the Methods section and reported previously [54,244], using the mean acid outputs from gastric acid control analysis from past admissions, all patients were assigned to one of three categories: the presence of sustained achlorhydria (>50% admission acid control = 0) [Achl], sustained hypochlorhydria (acid control levels from 0.1 to <1 mEq/h ->50%) [Hypo], and normal gastric acid in >50% acid controls ≥1 mEq/h [Acid]. The percentages represent the percent of patients in each VB12 group [i.e., all pts (n = 175); VB12-deficient patients (n = 37), and non-VB12-deficient patients (n = 138)], which were in each of the mean acid control categories. For all patients (n = 175), VB12-deficient (n = 37) groups, and non-VB12-deficient groups (n = 138), there were 60, 27, and 33 patients in the achlorhydric category, 47, 10, and 37 patients in the sustained hypochlorhydria category, and 68, 0, and 68 patients in the acid category, respectively. The presence of achlorhydria was significantly higher in the vitamin B12-deficient category of patients (73% vs. 24%) (p < 0.001) but not in the hypochlorhydria category (p = 0.99), and the presence of normal acid secretion was significantly higher in the non-VB12-deficient than VB12-deficient patients (49% vs. 0%) (p < 0.001).

