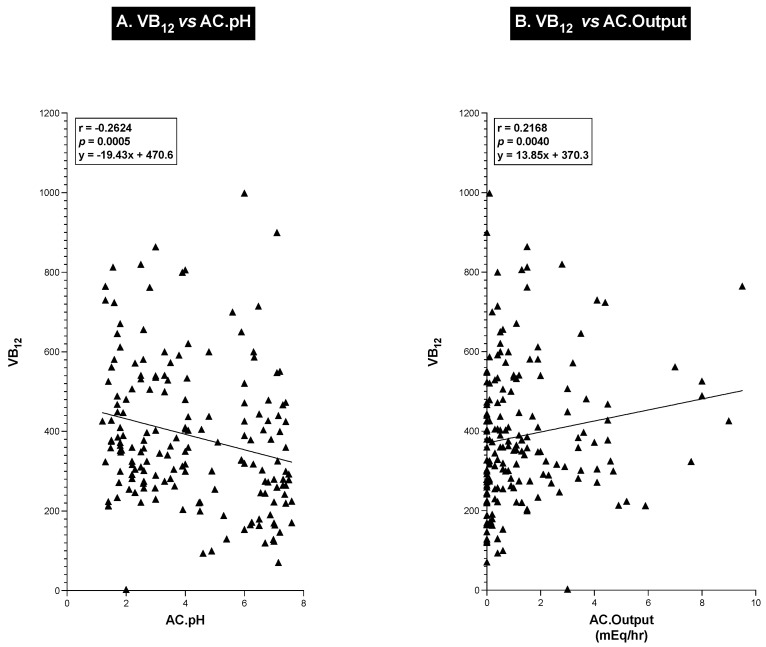
Figure 5.
Correlations between patient values for serum vitamin B12 levels and gastric acid control values after antisecretory drug intake (gastric acid hourly output after drug intake and pH of hourly gastric control sample). Each solid circle or triangle is a value from one patient determined from the same NIH admission. The correlation coefficient, its significance, and the best-fitted regression line equation (using least squares regression analysis) for each correlation are shown.

