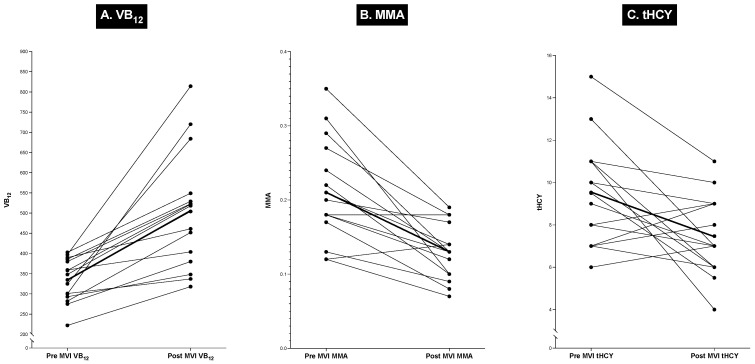
Figure 7.
Serum VB12, serum MMA, and plasma tHCY results from 15 non-VB12-deficient patients after taking multivitamin preparations. The results from 15 patients who had started on multivitamins on their own before their final evaluation are shown. The changes in blood VB12, MMA, and tHYC between their last two NIH evaluations are shown on the Y axis, with one being prior to starting any multivitamin and the other after taking a daily multivitamin preparation, all of which contained crystalline VB12. Each line shows the effects before or after the multivitamin ingestion. The serum VB12, MMA, and tHCY levels for a given patient, shown by the dark lines, represent the mean effect. The mean changes in serum VB12 (334 ± 15 to 504 ± 40 pg/mL (p = 0.0003)), MMA (0.21 ± 0.02 uM to 0.13 ± 0.01, (p = 0.0009)), and tHCY (9.50 ± 0.69 uM to 7.43 ± 0.52 uM (p = 0.0176)) are shown.

