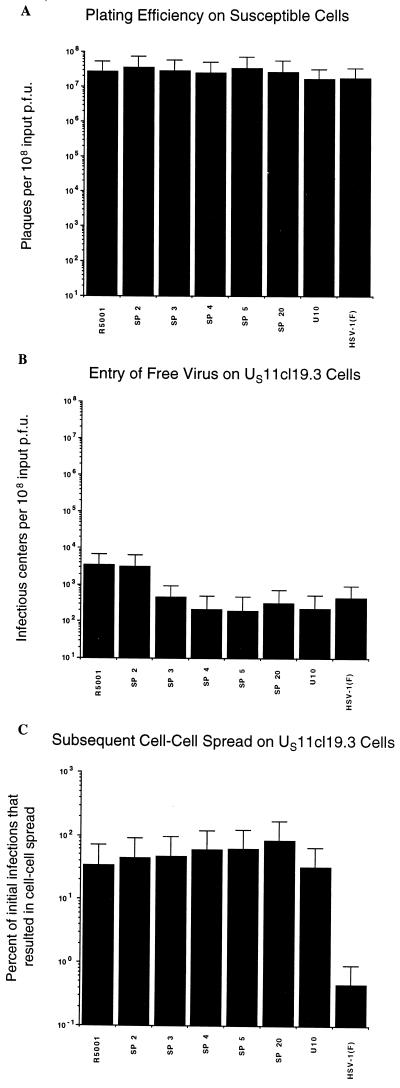
FIG. 2.
Efficiencies of initial infection and cell-cell spread by mutant viruses on susceptible and resistant cells. (A) Efficiency of plaque formation on susceptible 100-33 cells. (B) Efficiency of initial entry of free virus on resistant US11cl19.3 cells. (C) Efficiency of subsequent cell-cell spread on resistant US11cl19.3 cells plotted as a percentage of initial infections. Between 20 and 200 plaques were counted for each virus. All assays were conducted in triplicate. Error bars represent the range of values obtained.

