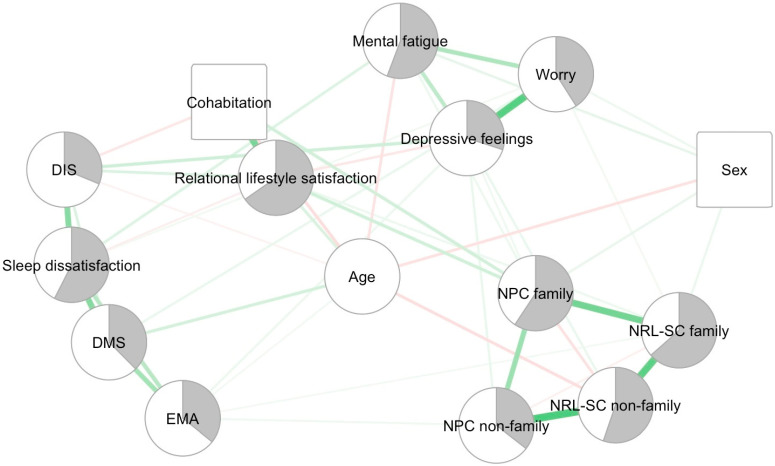
Figure 1.
Bayesian Gaussian Copula Graphical Model. Note: Circles represent continuous variables and square binary variables. The grey area in the nodes represents the mean scores on a scale from 1 to 5, a mean score of 3 being represented by half of the node shaded in grey. For relational lifestyle satisfaction, the scale was from 1 to 4. This grey area was not computed for the demographic variables. The weight of the edges is represented by their thickness and color saturation. Positive connections are green, and negative connections are red. An edge between two continuous variables (circles) represents a partial correlation. An edge between two binary variables (squares) or between a binary and a continuous variable represents a regression coefficient. NPC family = need for physical contact with family members; NPC non-family = need for physical contact with non-family members; NRL-SC family = need for real-life social contact with family members; NRL-SC non-family = need for real-life social contact with non-family members; DIS = difficulties initiating sleep; DMS = difficulties maintaining sleep; EMA = early morning awakenings.

