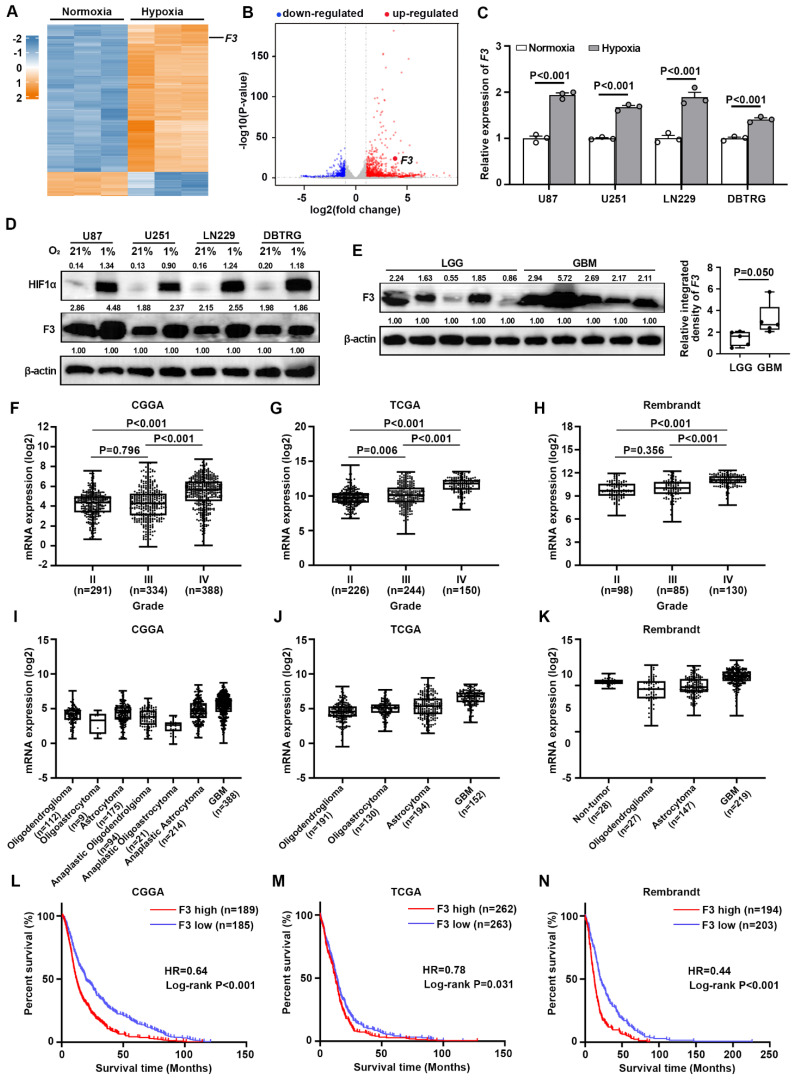
Figure 1.
F3 is a hypoxia-responsive gene in GBM and is related with glioma grade histology and patient survival. (A) Heatmap shows differentially expressed genes (DEGs) between normoxia and hypoxia in U87 cells on a scale from blue (downregulated) to red (upregulated). (B) Volcano plot shows DEGs between normoxia and hypoxia in U87 cells. Horizontal dashed line labels P = 0.05. Vertical dashed lines label |log2fold-change| = 1. (C) Validation of the expression level of F3 in normoxic and hypoxic GBM cells by RT-qPCR. (D) Protein levels of HIF1α and F3 in U87, U251, LN229 and DBTRG cells treated under normoxia and hypoxia detected by western blot. Relative integrated density normalized to β-actin was marked above each band. (E) Protein levels of F3 in LGG (n=5) and GBM (n=5) clinical samples detected by western blot. Relative integrated density normalized to β-actin is marked above each band. (F-H) The expression of F3 in different grades of glioma from (F) CGGA, (G) TCGA and (H) Rembrandt. (I-K) The expression of F3 in different histology of glioma from (I) CGGA, (J) TCGA and (K) Rembrandt. (L-N) Kaplan-Meier survival analysis shows the survival curves of glioma patients with high or low F3 expression level from (L) CGGA, (M) TCGA and (N) Rembrandt. Data are shown as mean ± SEM (error bars) and were analyzed using Student's t test (C, E), ANOVA (F-H) and Log-rank test (L-N).

