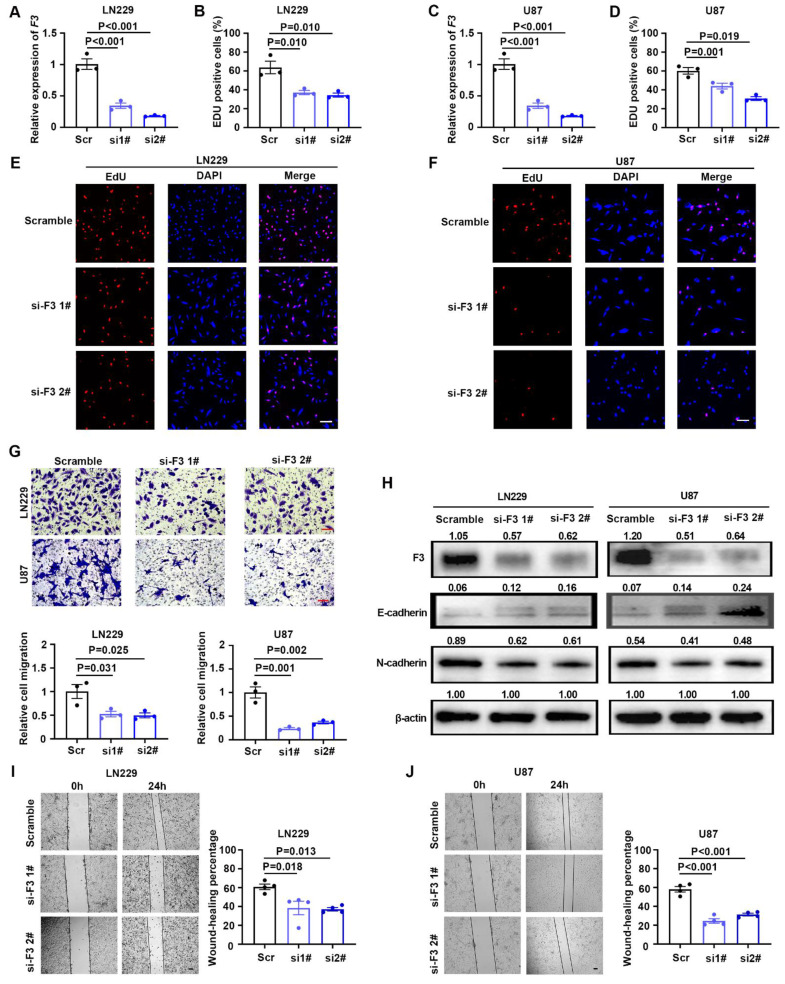
Figure 3.
Knockdown of F3 inhibits proliferation and migration of GBM cells under hypoxia. (A) Relative expression of F3 in LN229 cells transfected with indicated siRNAs targeting F3 compared with the scrambles validated by RT-qPCR. (B) Quantitative results of EdU assays after knockdown of F3 in LN229 cells under hypoxia. (C) Relative expression of F3 in U87 cells transfected with indicated siRNAs validated by RT-qPCR. (D) Quantitative results of EdU assays after knockdown of F3 in U87 cells under hypoxia. (E and F) Representative pictures of EdU assays in (E) LN229 and (F) U87 hypoxic cells after knockdown of F3. Scale bar: 100 μm. (G) Representative pictures (top) and quantitative data (bottom) of Transwell assays on LN229 and U87 hypoxic cells after knockdown of F3. Scale bar: 100 μm. (H) Representative images of Western Blot show protein levels of F3, E-cadherin and N-cadherin in LN229 and U87 hypoxic cells after knockdown of F3. Relative integrated density normalized to β-actin is marked above each band. (I and J) Wound-healing assays of (I) LN229 and (J) U87 hypoxic cells after knockdown of F3. Representative pictures are on left and quantitative data are on right. Scale bar: 100 μm. Data are shown as mean ± SEM (error bars) and were analyzed using ANOVA (A-D, G, I and J).

