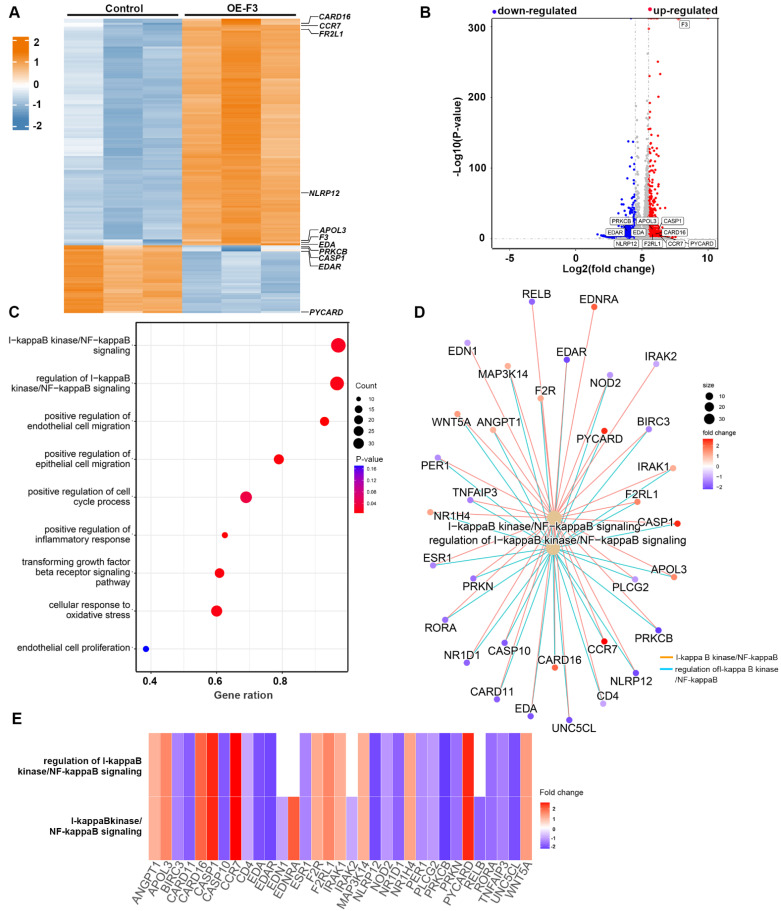
Figure 4.
RNA sequencing profiles for F3 overexpressed LN229 cells under hypoxia. (A) Heatmap shows DEGs between OE-F3-LN229 and control cells on a scale from blue (downregulated) to red (upregulated). (B) Volcano plot of these DEGs. Horizontal dashed line labels P = 0.05. Vertical dashed lines label |log2fold-change| = 1. (C) Gene Set Enrichment Analysis (GSEA) of DEGs in OE-F3-LN229 cells. (D) Construction of gene set enrichment regulatory network with NF-κB pathways. (E) Heatmap of DEGs enriched in NF-κB pathways.

