Figure 4.
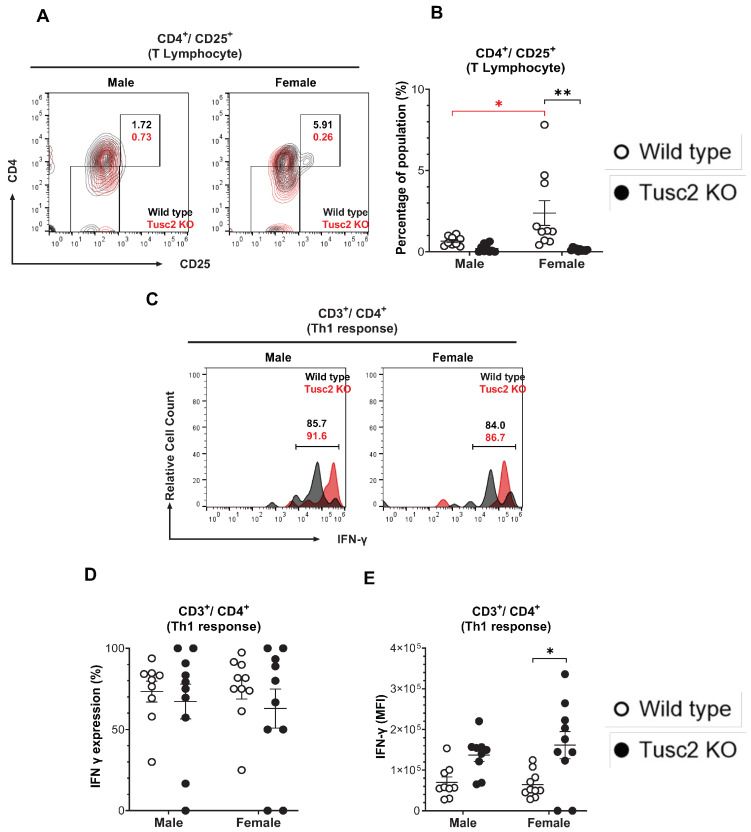
Tusc2 deficiency causes alterations in CD4+ T and Th1 cells in the brain. (A) Representative contour dot plot graph comparing the differences of T lymphocyte population (CD4+/CD25+) between the Wild type (black) and the Tusc2 KO (red) models in males and females. (B) CD4 T cell proportions in the CNS were significantly decreased in KO females (p = <0.0001); no significant difference was observed in males. (C) Representative histogram showing the difference in IFN-γ expression between CD4+/CD25+ T lymphocytes (Th1 response) of Wild type (black) and Tusc2 KO (red) male and female models. (D) CD4 T cell subset Th1 cells were evaluated. (E) MFI values of IFN-γ cytokine-producing CD4 T cells were significantly decreased in Tusc2 KO female mice (p = 0.0068); male KO mice showed no significant difference (p = 0.2136) in proportion as compared to their WT counterparts. Two-way ANOVA followed by Bonferroni’s multiple comparisons test. * p ≤ 0.05, ** p ≤ 0.01. n = 10 mice per group. For bar graphs, the black asterisk denotes comparisons between the WT and KO models, while the red asterisk represents the comparison between the sexes. “Percentage of population” indicates the proportion of all events in the population gating shown at the top of the graphic.

