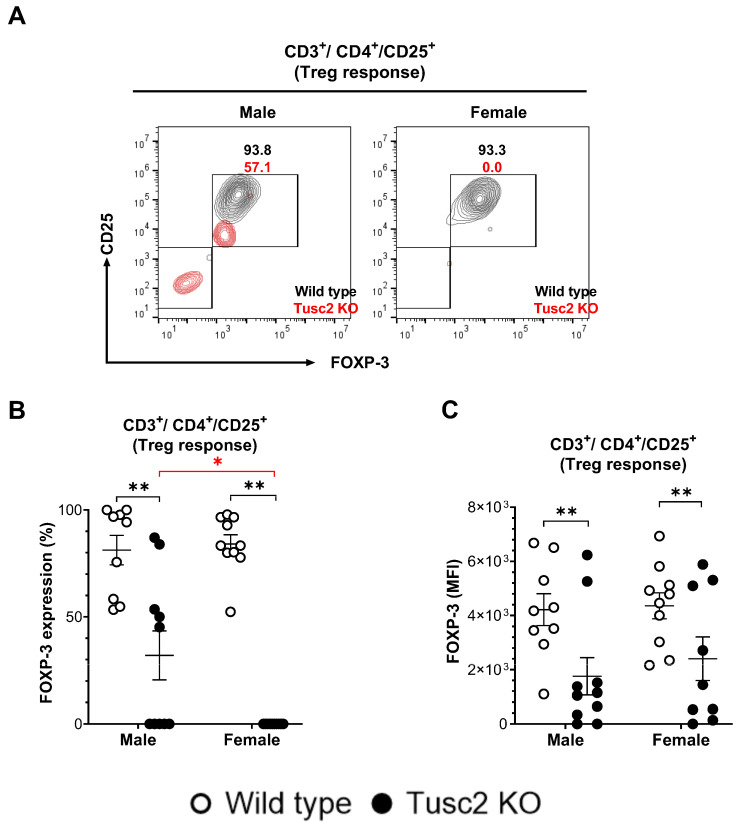
Figure 6.
Lack of Tusc2 disrupts the inhibitory mechanisms of immune cells responsible for regulating inflammation. (A). Representative contour dot plot graph showing the difference in FOXP-3 expression between CD3+/CD4+/CD25+ T lymphocytes (Treg response) of Wild type (black) and Tusc2 KO (red) male and female models. (B,C) Flow analysis revealed a decrease in the overall proportion and MFI value of Treg cells for KO males (p = 0.0001) and KO females (p = <0.0001). Two-way ANOVA followed by Bonferroni’s multiple comparisons test. * p ≤ 0.05, ** p ≤ 0.01. n = 10 mice per group. For bar graphs, the black asterisk denotes comparisons between the WT and KO models, while the red asterisk represents the comparison between the sexes.

