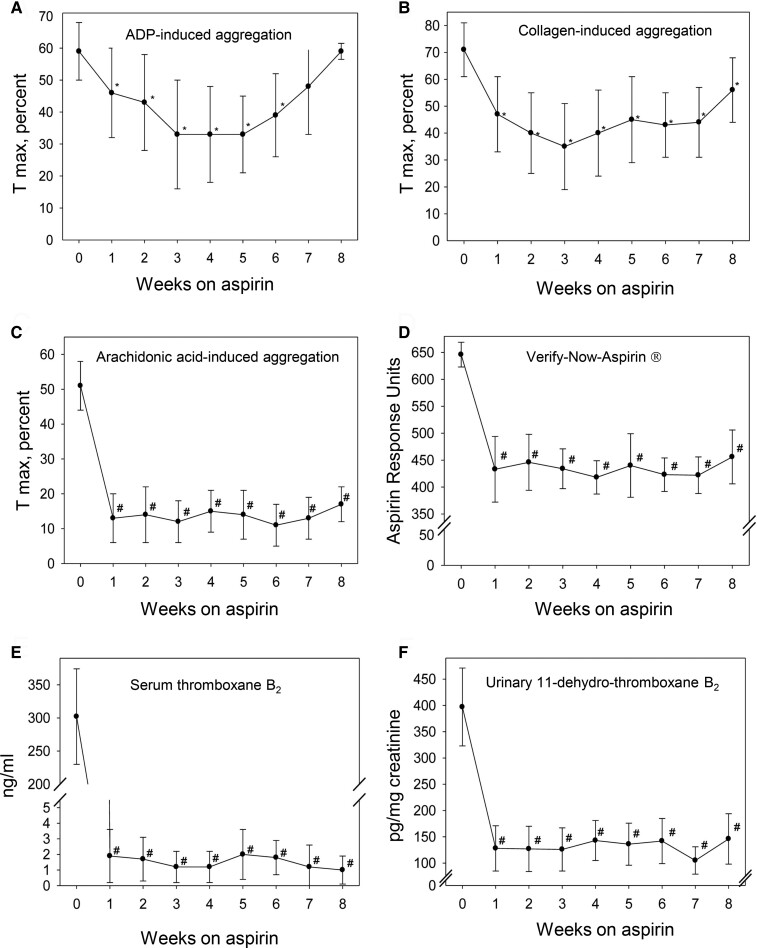
Figure 4.
Platelet biochemical and functional assays before and during aspirin intake in healthy subjects. Maximal aggregation (Tmax) values of adenosine diphosphate (A), collagen-induced (B), and arachidonic acid–induced (C) aggregation; aspirin response units of VerifyNow Aspirin (D); and absolute values of serum thromboxane B2 (E) and urinary 11-dehydro-thromboxane B2 (F) at baseline and during aspirin intake. Values are mean ± standard deviation of baseline [week 0 (n = 48), week 1 (n = 47), week 2 (n = 42), week 3 (n = 34), week 4 (n = 28), week 5 (n = 23), week 6 (n = 17), week 7 (n = 11), and week 8 (n = 6)]. *P < .01 vs. baseline. #P < .001 vs. baseline. Reproduced from Santilli et al.,23 with permission from Elsevier

