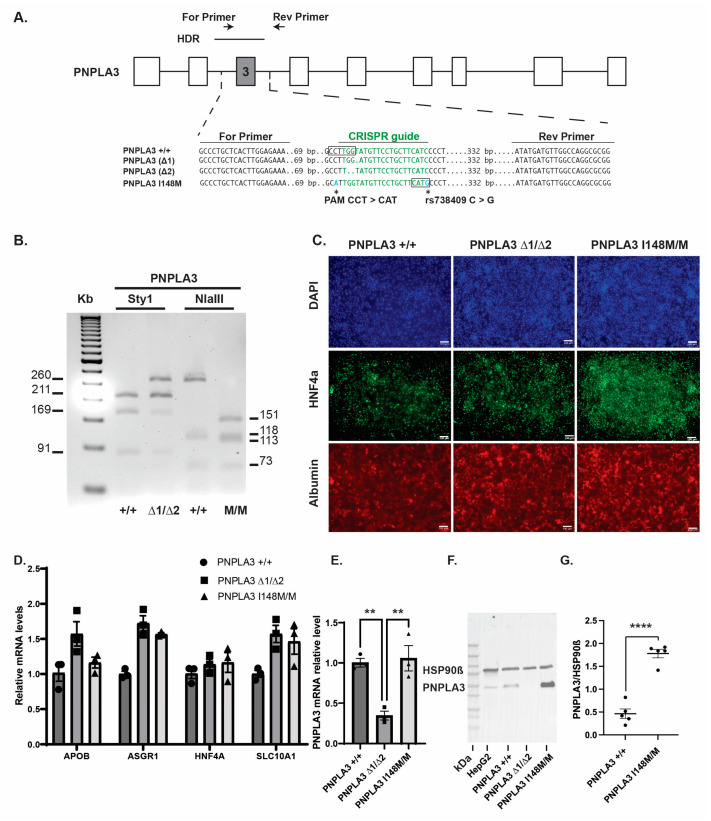
Figure 1.
Generation of PNPLA3∆1/∆2, and PNPLA3I148M/M iPSC-derived hepatocytes. (A) Schematic illustration of PNPLA3 locus showing the nucleotide sequences within exon 3 of the PNPLA3 wildtype and mutated alleles; the CRISPR/Cas9 guide sequence (green); the relative positions of the primers used to identify the mutations and C > G substitution (rs738409); and the relative position of the HDR template and its sequence containing a silent substitution at the PAM site (blue). StyI and NlaIII cut sites are boxed. (B) Agarose gel showing PCR amplicons digested with Sty1 or NlaIII. The StyI recognition site is disrupted in the Δ2 indel resulting in a 260 bp band in PNPLA3∆1/∆2 instead of the 91 and 169 bp bands in PNPLA3+/+ cells. Residual 91 and 169 bp bands were detected in the PNPLA3∆1/∆2 since the StyI cut site is not disrupted in the allele with the Δ1 indel. The C to G substitution in the PNPLA3I148M/M line creates an NlaIII recognition site, creating products of 151 bps and 113 bps in PNPLA3I148M/M cells compared to a 264 bp product in wildtype. (C) Immunostaining showing expression of hepatic markers HNF4a and Albumin in day 20 PNPLA3+/+, PNPLA3∆1/∆2, and PNPLA3I148M/M iPSC-derived hepatocytes compared to DAPI. Scale bar, 100 µm. (D) Bar graph showing the results of qRT-PCR for characteristic hepatocyte mRNAs in day 20 PNPLA3+/+, PNPLA3∆1/∆2, and PNPLA3I148M/M iPSC-derived hepatocytes (n = 3 biological replicates, mean ± SEM). (E) Bar graph showing the results of qRT-PCR of relative steady-state PNPLA3 mRNA levels in PNPLA3+/+, PNPLA3∆1/∆2, and PNPLA3I148M/M iPSC-derived hepatocytes on day 20 (n = 3 biological replicates, mean ± SEM, ANOVA ** p ≤ 0.01, PNPLA3+/+ vs. PNPLA3∆1/∆2 CI [0.2180,1.097], and PNPLA3∆1/∆2 vs. PNPLA3I148M/M CI [−1.152, −0.2730]). (F) Immunoblots using mouse monoclonal anti-ADPN (C-8) that specifically detects PNPLA3 in extracts from HepG2 cells, PNPLA3+/+, and PNPLA3I148M/M, but not in PNPLA3∆1/∆2 iPSC-derived hepatocytes. (G) Quantification of immunoblots demonstrating a 3.8-fold increase in steady-state PNPLA3 I148M/M protein levels (n = 5 biological replicates, **** p ≤ 0.0001).

