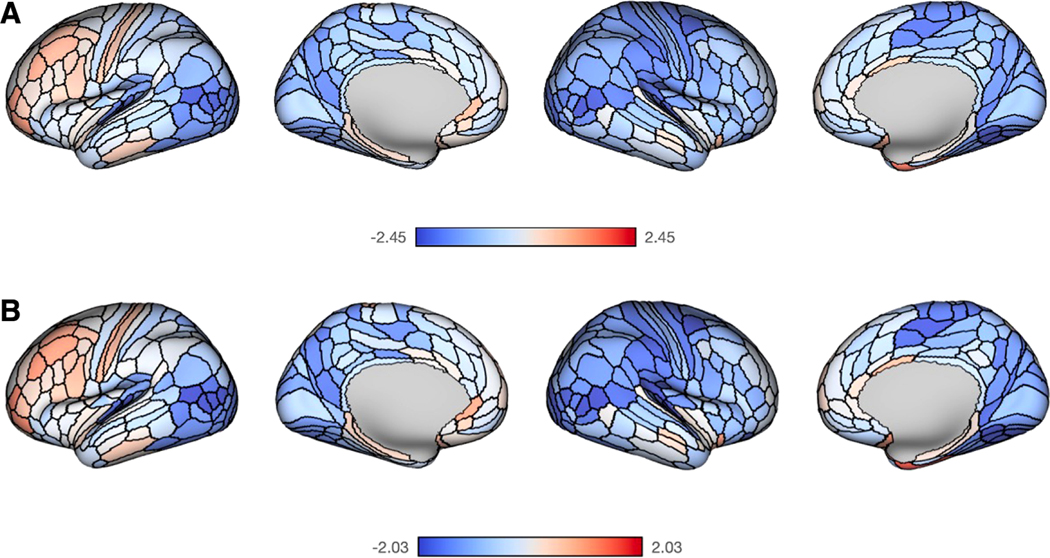
Fig. 1.
Associations between family income and T1w/T2w ratio. (A) Maps represent t-statistics across cortical parcellations of the association between log income-to-needs ratio and T1w/T2w ratio based on the model: Regional T1w/T2w ~ log Income-to-needs-ratio + s(Age) + Sex + Site + “B1+” bias correction covariates, where s(Age) is a generalized additive age spline. (B) Maps represent t-statistics across cortical parcellations of the association between log income-to-needs ratio and the regional myelin deviation scores based on normative modeling, controlling for participants’ actual age.

