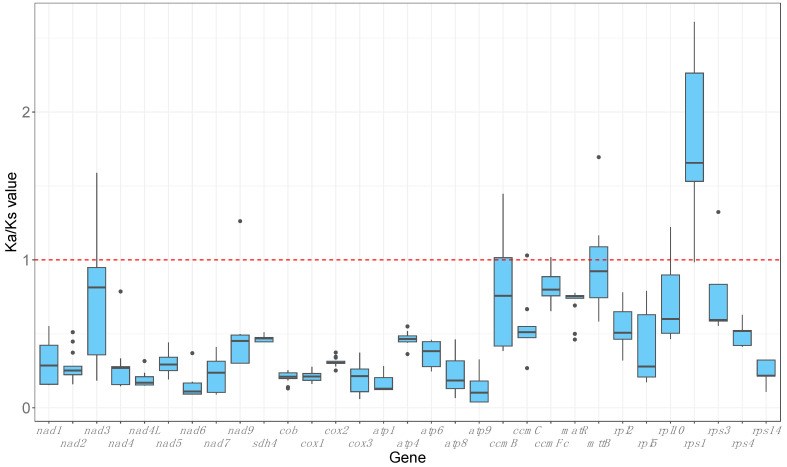
Figure 8.
Graphical representation of pairwise comparisons of non-synonymous substitution rate (Ka) and synonymous substitution rate (Ks) ratios among species from the orders Myrtales and Geraniales, utilizing Ludwigia grandiflora subsp. hexapetala and Ludwigia peploides subsp. montevidensis as references, across 31 mitochondrial genes. Genes were included if they were present in at least 14 out of the 16 selected species.

