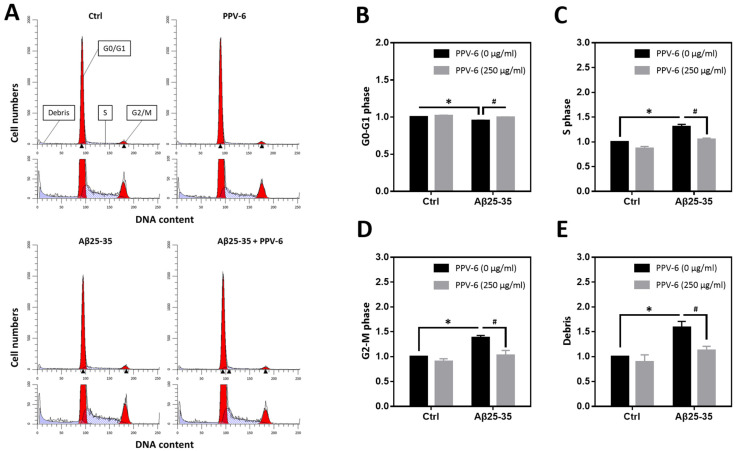
Figure 3.
PPV-6 attenuates neuronal cell cycle progression induced by Aβ25-35 based on flow cytometry. Primary cortical neurons were exposed to Aβ25-35 (10 μM) with or without PPV-6 (250 μg/mL) for 16 h. This was followed by staining with propidium iodide (PI) and then flow cytometry to detect cellular DNA contents. Representative histograms showing the cell numbers in each phase, based on their relative DNA contents, are presented in (A). Quantitative analyses of the fold changes in cell numbers in the G0/G1 phases, S phase, and G2/M phases as well as cellular debris with fragmented DNA are respectively shown in (B–E). Mean ± SEM from N = 4. Data were analyzed by means of a one-way ANOVA followed by a post-hoc Tukey test. * and # denote p < 0.05.

