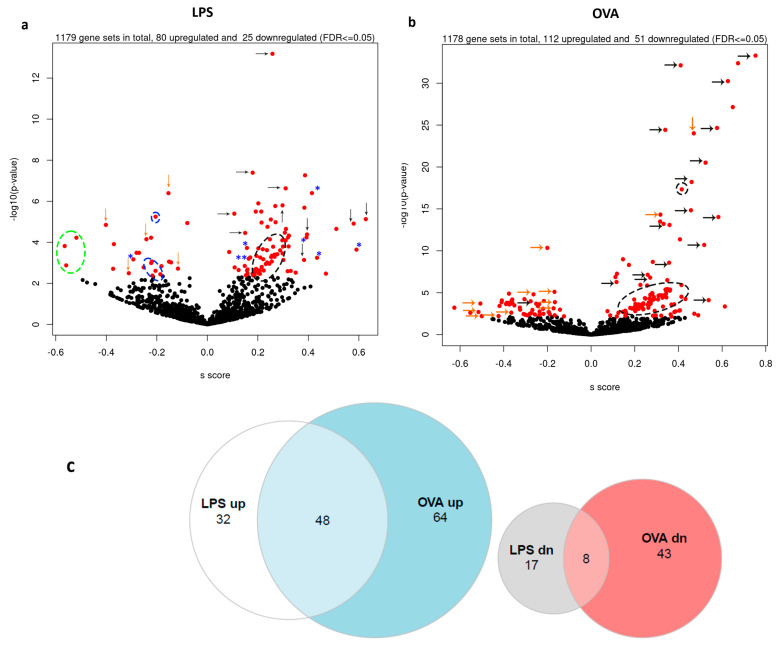
Figure 1.
Effect of LPS− and OVA−treated groups on mouse transcriptome gene set analysis in the hypothalamus. (a,b) Volcano plot of gene set enrichment analysis for the LPS− and OVA−treated groups, respectively. The black and orange arrows indicate the altered gene sets that are associated with metabolism and nervous system function, respectively. Black annotated circles refer to inflammatory and cytokine gene sets, blue circles indicate immune system gene sets, and the green circle refers to the homeostasis gene sets. Autophagy and cellular response to stimuli gene sets are indicated by the blue asterisks. Please refer to Supplementary Figures S5 and S6 for detailed information. (c) Venn diagram showing the common gene pathways with differential expression.

