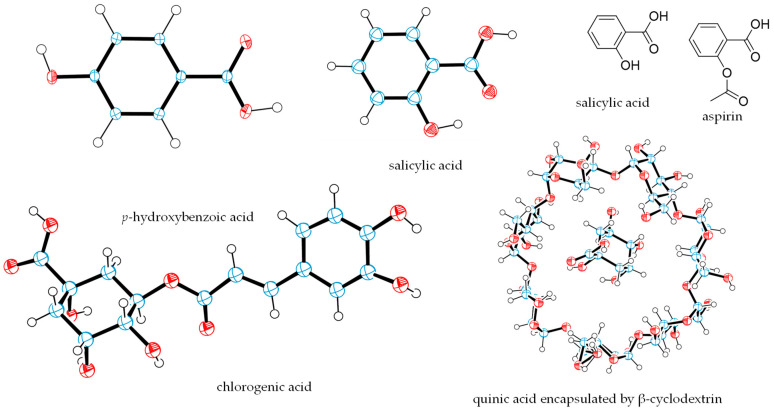
Figure 3.
Crystal structures of p-hydroxybenzoic acid, salicylic acid, chlorogenic acid, and quinic acid encapsulated by β-cyclodextrin (β-CD) and the structures of salicylic acid and aspirin. The crystal structure plots were drawn using ORTEP-3 for Windows version 2020.1 [53], based on data from the literature. The ORTEP diagram for quinic acid shows one of the two complexes of quinic acid and β-CD, for which water molelcules are omitted, and the disordered region of the β-CD molecule is presented. In the ORTEP plots, oxygen atoms are red, carbon atoms are blue, and the small white circles represent hydrogen atoms, which are drawn with an artificial radius.

