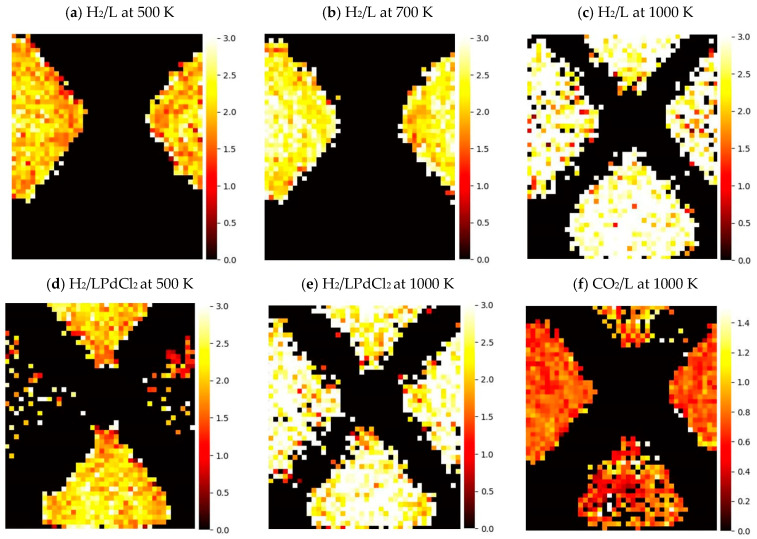
Figure 2.
The heat maps of the average speed projected on an ac-plane of MOF-253: (a–c) 1 H2 in L at 500, 700, and 1000 K, respectively; (d,e) 1 H2 in LPdCl2 at 500 and 1000 K, respectively; (f) 1 CO2 in L at 1000 K. Each color pixel of the heat map denotes the recorded molecular speed observed in the volume 0.5 × b-axis × 0.5 (Å3) and weighted by the number of observed events. The unit of y-axis denotes the average speed at Å/100 fs. Figure S1 provides the schematic perspective of the ac-plane of MOF-253.

