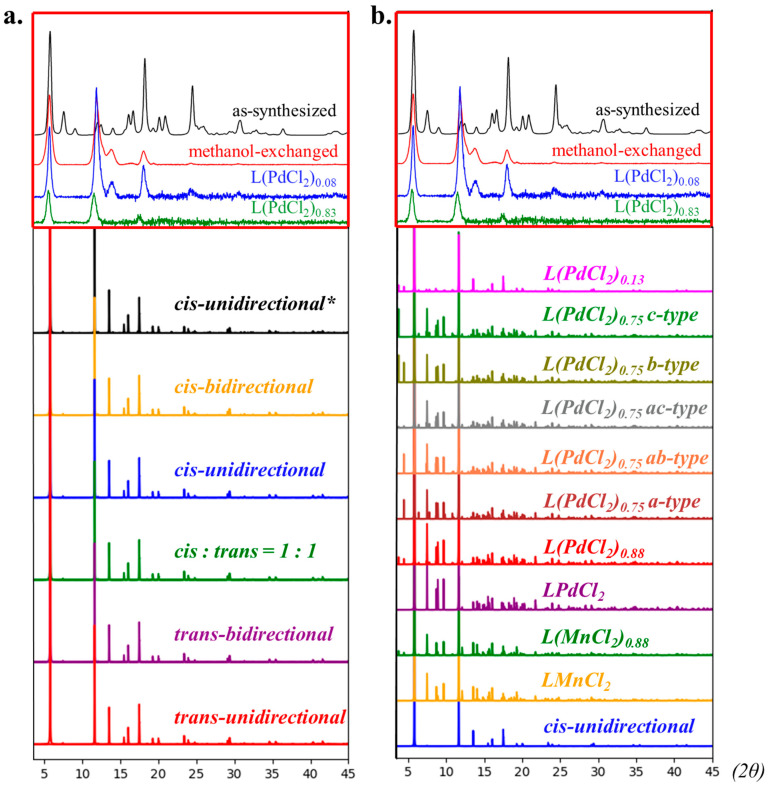
Figure 4.
The simulated PXRD spectra. The red squares in (a,b) are experimental PXRD spectra that were retrieved from the report by Bloch et al. [13]. (a) The comparison between different isomers of L. The black line with the label * is the L model that was built from L(PdCl2) and then had the metal complexes “vertically” removed. It converted to the PXRD data without re-optimization by DFT computation. (b) The comparison between different numbers of MCl2 incorporated into the cis-NN structures that were discussed in our previous study [21].

