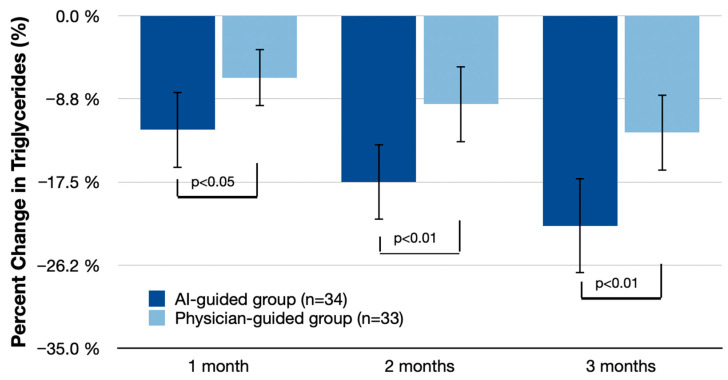
Figure 3.
Mean percent serum triglycerides change (% change from baseline (95% CI)) at 1 month, 2 months, and 3 months. Statistical analysis includes independent t-tests for percent changes from baseline to the end of the study and repeated measures ANOVA for within-subject comparisons over time. Bonferroni correction was applied in post-hoc comparisons with control for the family-wise error rate.

