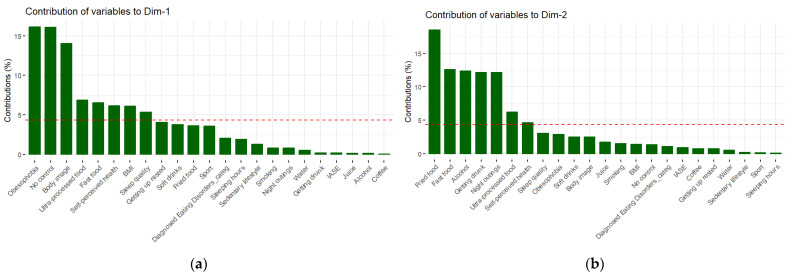
Figure 2.
(a) Contribution of the variables to the first dimension of the PCA model. Note: The red line indicates the average percentage of contribution if all the dimensions contribute the same. (b) Contribution of the variables to the second dimension of the PCA model. Note: The red line indicates the average percentage of contribution if all the dimensions contribute the same.

