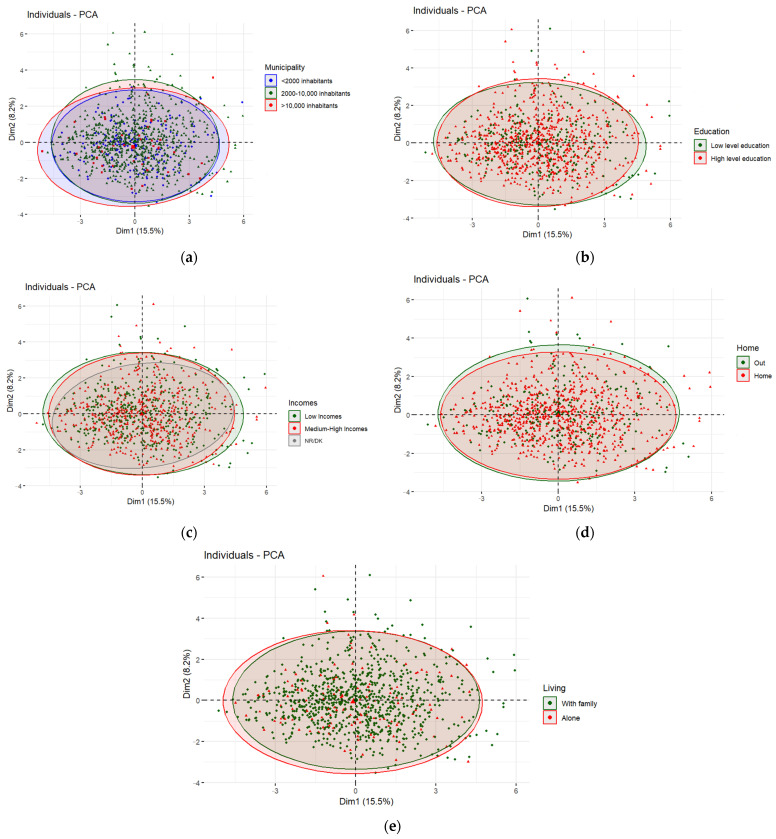
Figure 6.
(a) Individuals plot of the PCA model depending on municipality. (b) Individuals plot of the PCA model depending on education. (c) Individuals plot of the PCA model depending on incomes. (d) Individuals plot of the PCA model depending on home. (e) Individuals plot of the PCA model depending on living.

