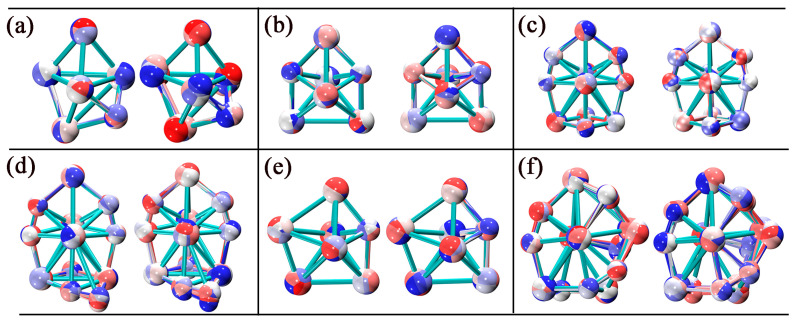
Figure 5.
AIMD simulation trajectories of (a) Nb5C; (b) Nb5C2; (c) Nb5C6; (d) Nb5C7; (e) Nb6C; and (f) Nb6C7. The left and right sides of each small image represent the trajectories at 100 K and 300 K, respectively. The structures are extracted every 100 fs, the color corresponds to the time step and varies as red–white–blue.

