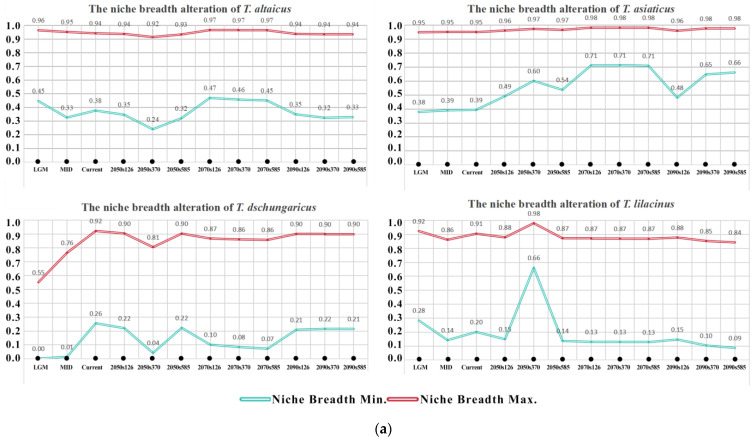
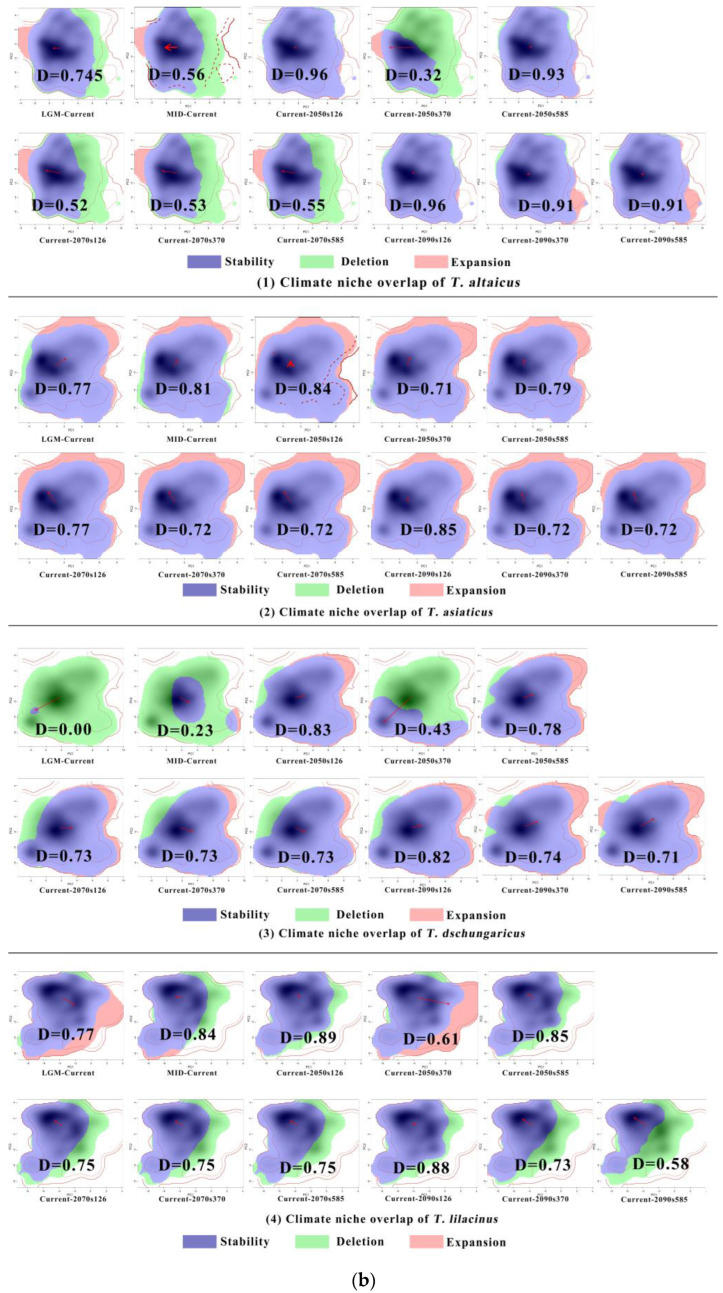
Figure 5.
(a) Alteration in climate niche breadth for the four Trollius species. (b) Climate niche overlap of four Trollius species. Note: The solid and dashed contour lines illustrate 100% and 50% of the available environmental space, respectively. Red arrows show how the center of the climatic niche (solid line) and the background range (dashed line) of Trollius moved between the two ranges. D = 0.888 indicates that the Schoener’s D niche overlap index is 0.888. The x-axis and y-axis represent the value of principal components (PC1 and PC2).


