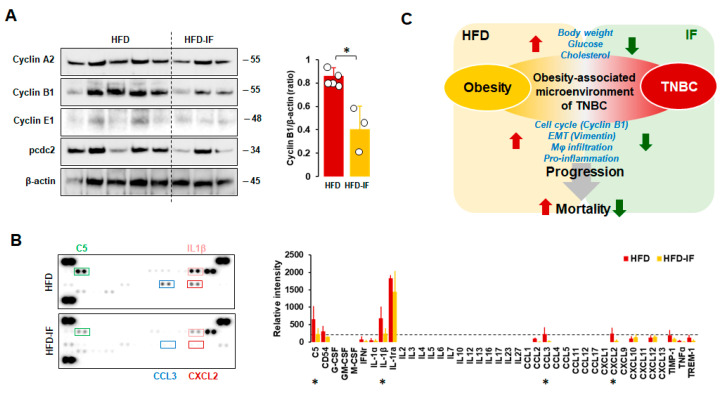
Figure 9.
Comparison between HFD and HFD-IF of the cell cycle and cytokine signature. (A) Comparative effects of HFD and HFD-IF on cell cycle-related protein expression levels in tumor tissues. Tumor lysates were prepared, and Western blots were carried out using antibodies specific to cell cycle phase-related proteins. β-actin was used as a loading control. Column graph indicates a significant difference between HFD (n = 5) and HFD-IF (n = 3) on cyclin B1 expression levels. All data are shown as mean ± SD. * p < 0.05 in each group as calculated by the paired Student’s t-test. (B) Cytokine signatures of tumor tissues in HFD and HFD-IF mice by proteomic array. Relative intensity of spots to express cytokine levels was calculated by ImageJ. All data are shown as mean ± SD. Total spots from HFD and HFD-IF are n = 10/protein and n = 6/protein, respectively. * p < 0.05 in each group as calculated by the paired Student’s t-test in samples above the threshold value (relative intensity = 200, dot line). Representative pictures were selected from among tumor tissues from HFD and HFD-IF mice. C5: complement component 5; CD54: cluster of differentiation 54 or intercellular adhesion molecule 1 (ICAM-1); G-CSF: granulocyte colony-stimulating factor; GM-CSF: granulocyte-macrophage CSF; M-CSF: macrophage CSF; IFNγ: interferon-gamma; IL-1ra: interleukin-1 receptor antagonist; CCL: C-C motif chemokine ligand; CXCL: C-X-C motif chemokine ligand; TIMP1: tissue inhibitor matrix metalloproteinase 1; TNFα: tumor necrosis factor α; TREM-1: triggering receptor expressed on myeloid cells. (C) Schematic for inhibitory effects of IF on HFD-induced TNBC progression.

