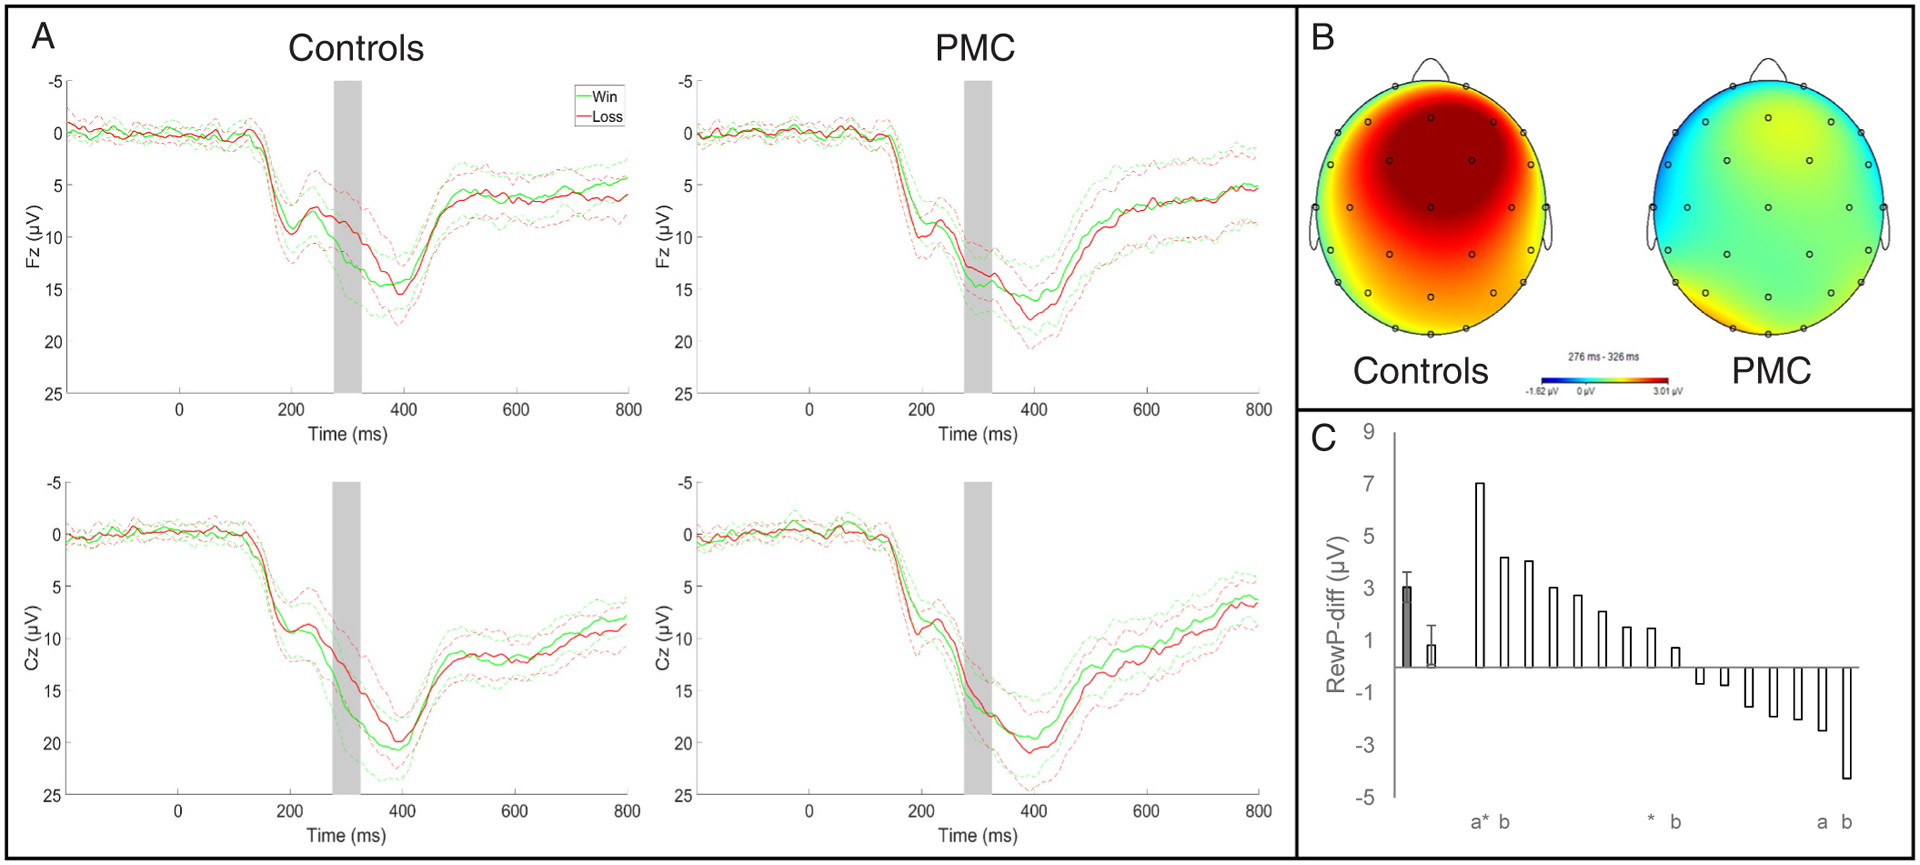
Fig. 1.

A) Waveforms are presented separately for monetary wins and losses; solid lines represent mean activity and dotted lines represent the 95% confidence interval. Shaded gray bars indicate the time window where the RewP was scored (275–325 ms). B) Headmaps depict the contrast of win versus loss conditions (i.e. RewP-diff). C) Average RewP-diff amplitude for controls (gray bar, left) and PMC (first white bar). Error bars show the standard error of the mean for each group. RewP-diff amplitude for individual PMC are depicted by subsequent white bars. Nested data for family members among the premutation group are indicated by a (family 1) and b (family 2); * ‘s indicate participants who were currently in a major depressive episode at the time of data collection.
