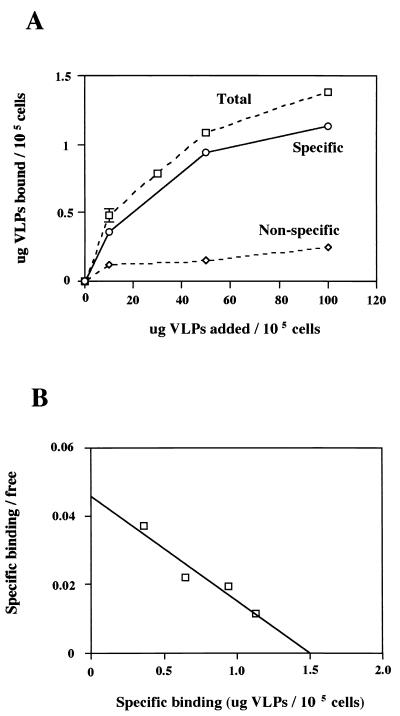
FIG. 1.
(A) Dose-response curve of the total, nonspecific, and specific binding of rUEVs. One group of confluent Caco-2 monolayers grown in 48-well plates (1.5 × 10⁵ cells/well) was incubated for 1 h at 4°C with an increasing amount of 35S-labeled rUEVs (0 to 150 μg) in 80 μl to determine the total binding (▫). The other group of plates was preincubated in the presence of a 20-fold excess amount of unlabeled rUEVs to determine nonspecific binding (◊). The specific binding was calculated by subtracting the nonspecific binding from the total binding (○). Each plot represents the mean value (with error bar). Each assay was done in duplicate or triplicate. (B) Scatchard plot analysis of the specific binding of rUEVs to Caco-2 cells. The intercept of the x axis represents the value of the saturated quantity (in micrograms) of the rUEVs specifically bound to 105 cells.

