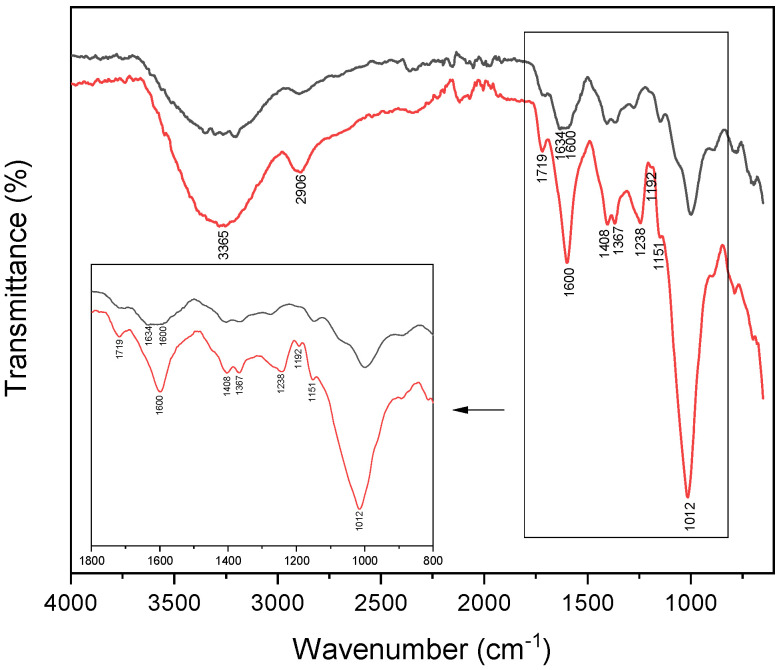
Figure 5.
FT-IR spectra of xanthan gum alone (red line) and xanthan gum after reaction with laccase (black line). In the inset, the region from 1800 to 800 cm−1 is highlighted. The sample of oxidized xanthan gum was prepared maintaining the same ratios used in the final chitosan-polydopamine-xanthan gum formulation. The analysis was performed on powders at room temperature.

