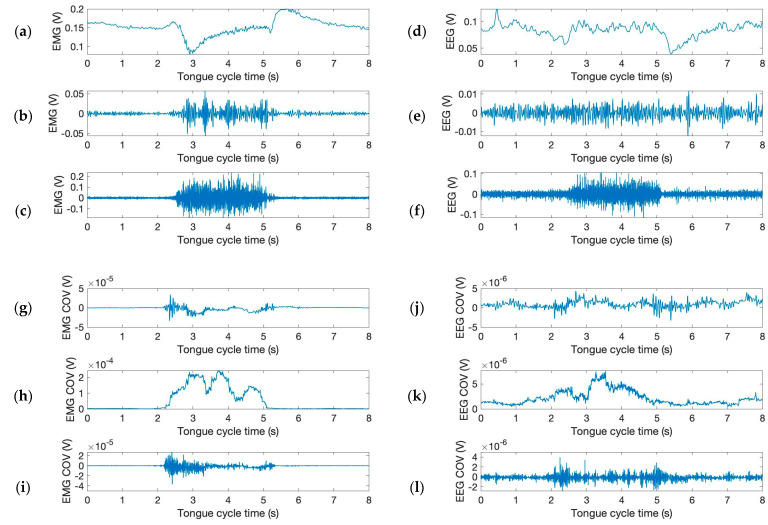
Figure 4.
Moving window covariance calculated from the variation in EMG and EEG sensor signal. (Upper) The filtered time and amplitude signals from the mandible and left-brain locations: (top) (a,d) below 13 Hz, (b,e) between 13 and 30 Hz, and (c,f) above 30 Hz. (Lower) The time and covariance characteristics obtained from the graphs in (a–f): (g,j) below 13 Hz—between 13 and 30 Hz, (h,k) between 13 and 30 Hz—above 30 Hz, and (i,l) below 13 Hz—above 30 Hz.

