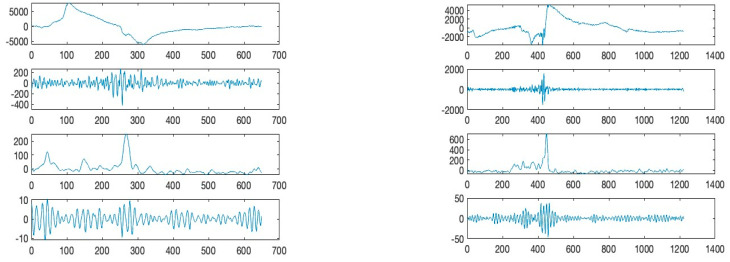
Figure 6.
The time and amplitude characteristics of a typical EMG-contaminated EEG signal derived from the left-brain region (left: ‘D’ and right: ‘M’). From the top graph: (6-1) low-frequency component of EMG (<25 Hz); (6-2) high-frequency component of EMG (>25 Hz); (6-3) alpha and beta component of EEG; (6-4) gamma component of EEG.

