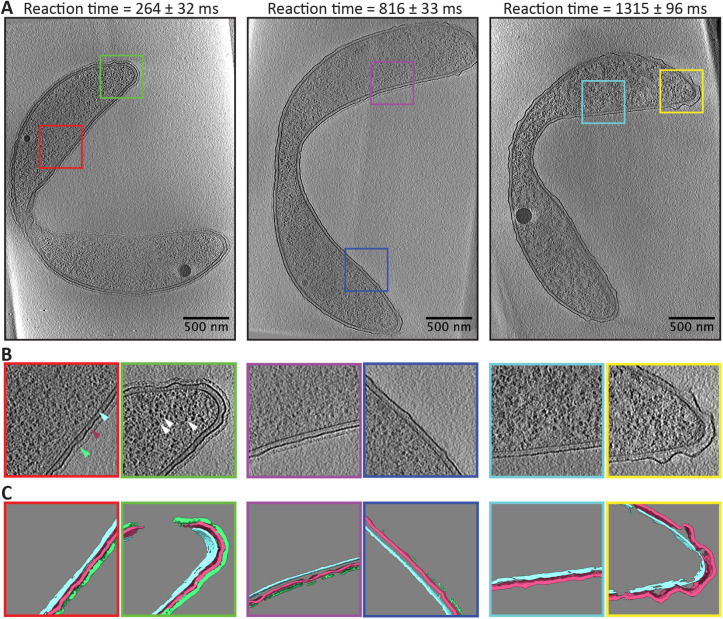
FIGURE 3:
Representative tomography data from time-resolved pH jump. (A) Single slices from the tomographic reconstruction of a representative cell frozen at the listed reaction times. Colored squares highlight zoomed in regions shown in (B) where the S-layer (green pointer), outer membrane (maroon pointer), inner membrane (cyan pointer), and ribosomes (white pointers) are clearly visible. (C) Segmentation of the central 50 slices of the tomographic reconstructions shown in B. The segmentation highlights the S-layer (green), the outer membrane (maroon), and inner membrane (cyan). These segmentations from the central slices were used for subsequent data analysis.

